

EUR/USD Talking Points:
- EUR/USD has had a strong 2025, so far, with the pair testing below 1.0200 in January and above 1.1500 earlier this week.
- EUR/USD is now overbought on the weekly chart and this is the first such instance since the summer of 2020. This doesn’t spell automatic reversal, but it does make the prospect of chasing the trend higher as at least a bit more daunting.

Coming into the year parity calls were widespread as EUR/USD was selling off with a full head of steam. The pair attempted a bounce in early December after the post-election sell-off, but sellers stood at the ready to offer resistance at 1.0611, and that extended the downside move through the first two weeks of the new year.
But that’s around when support began to show up, and it wasn’t a fast turn as reversals often aren’t, but it was gyration in the month of February that started to open the door for a bigger picture reversal in the pair.
Interestingly, the tariff topic had some sway on both sides of the matter. In February, tariffs were a USD-positive item and deductively, that was EUR/USD negative. The first mention of tariffs on Europe after the inauguration happened on the first weekend of February, and this provided a shock to EUR/USD but notably, the pair held a higher-low. For the rest of the month the 1.0500 level remained as resistance, but by the time March rolled around, there were growing fears of recession in the U.S. and suddenly, tariffs were a USD-negative item.
This led to one of the strongest breakouts ever seen in EUR/USD in the first month of March, with the pair hurriedly jumping up to the 1.0943 level, which is the 50% mark of the same Fibonacci retracement that caught the lows in January at the 23.6. The pullback from that remained somewhat shallow, with the 200-day moving average coming in to hold the lows before buyers took another significant step forward with the breakout in April which was, once again, fueled by tariff concerns that brought a USD-negative appeal.
EUR/USD Weekly Chart
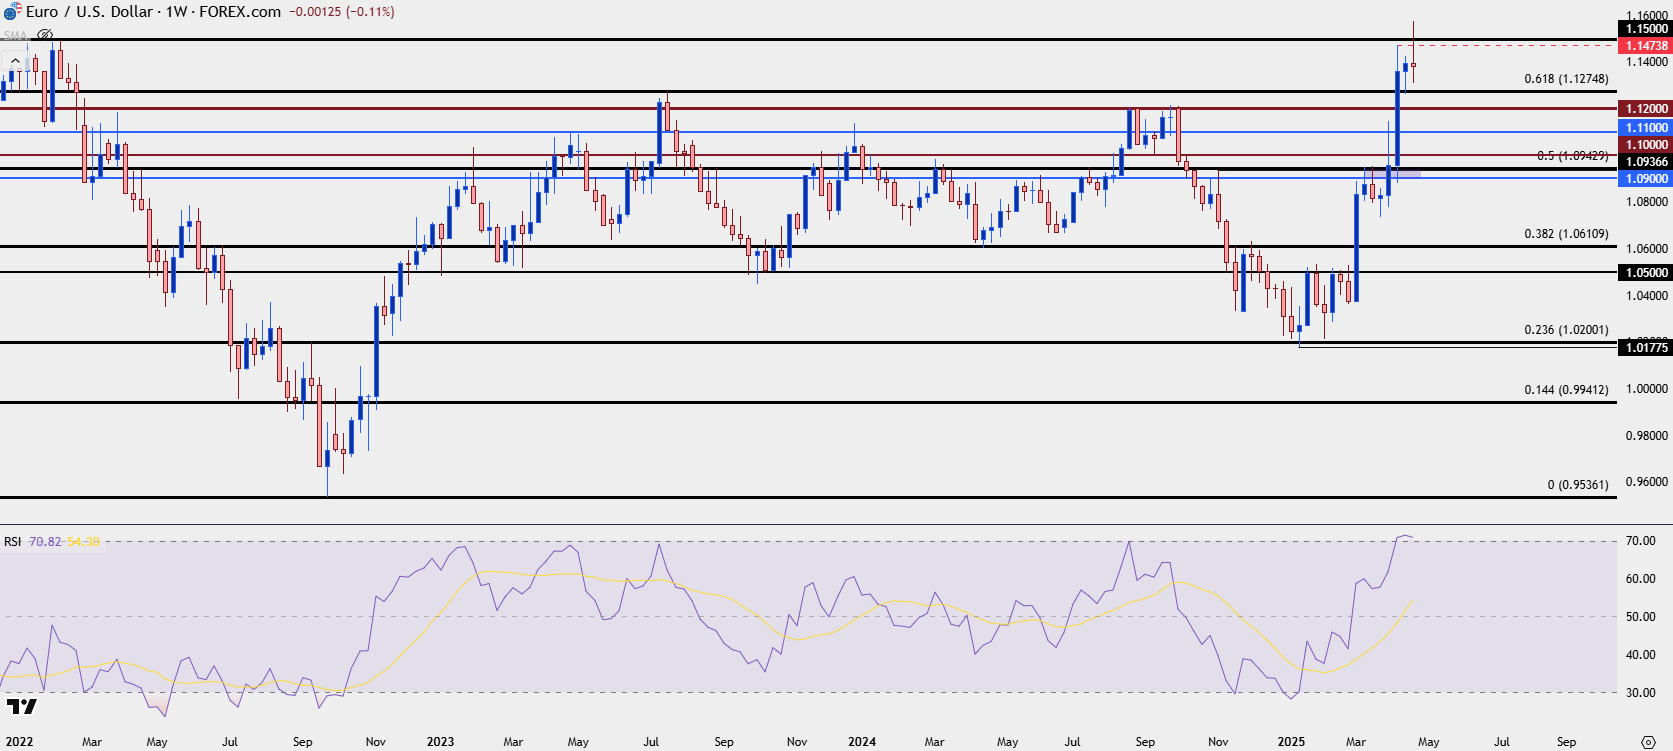 Chart prepared by James Stanley; data derived from Tradingview
EUR/USD Overbought
From the weekly chart above you can see the RSI reading in overbought territory, which is somewhat of a rare occurrence for the pair. The last instance of such is all the way back in 2020 when the USD was surging lower on the back of the Fed’s response to the Covid pandemic. And just as I had highlighted in yesterday’s webinar, this is not an automatic push for reversal – and that prior instance illustrates that as it took the pair another four months to top before ultimately going into a strong reversal in 2021 and 2022.
But – it does highlight the challenge of chasing an already well-priced in move, and this can make breakout strategies as a less attractive way of working with the pair. Support, however, can remain of interest for higher-lows as that’s the point that bulls are on the spot to defend the trend. And it’s as that defense begins to wane or recede that a larger reversal can become more attractive.
We’ve already seen this play out to a degree as the overbought reading showed up last week and a pullback to the Fibonacci level at 1.1275 brought bulls back in for an extension of the move. That would remain a viable support level especially if there was respect of last week’s swing low at 1.1264. Below that, the 1.1200 level remains of interest as this was a brick wall of resistance last year, holding multiple episodes of resistance before the Q4 reversal took over. And there’s even a case for the 1.1100 handle, as this was resistance earlier in April but, to date, hasn’t been tested for support.
If that level does come into play, however, there could then be a setup for a lower-high that could begin to open the door for larger reversal themes, but at this point we have to consider it as support until proven otherwise.
EUR/USD Daily Price Chart
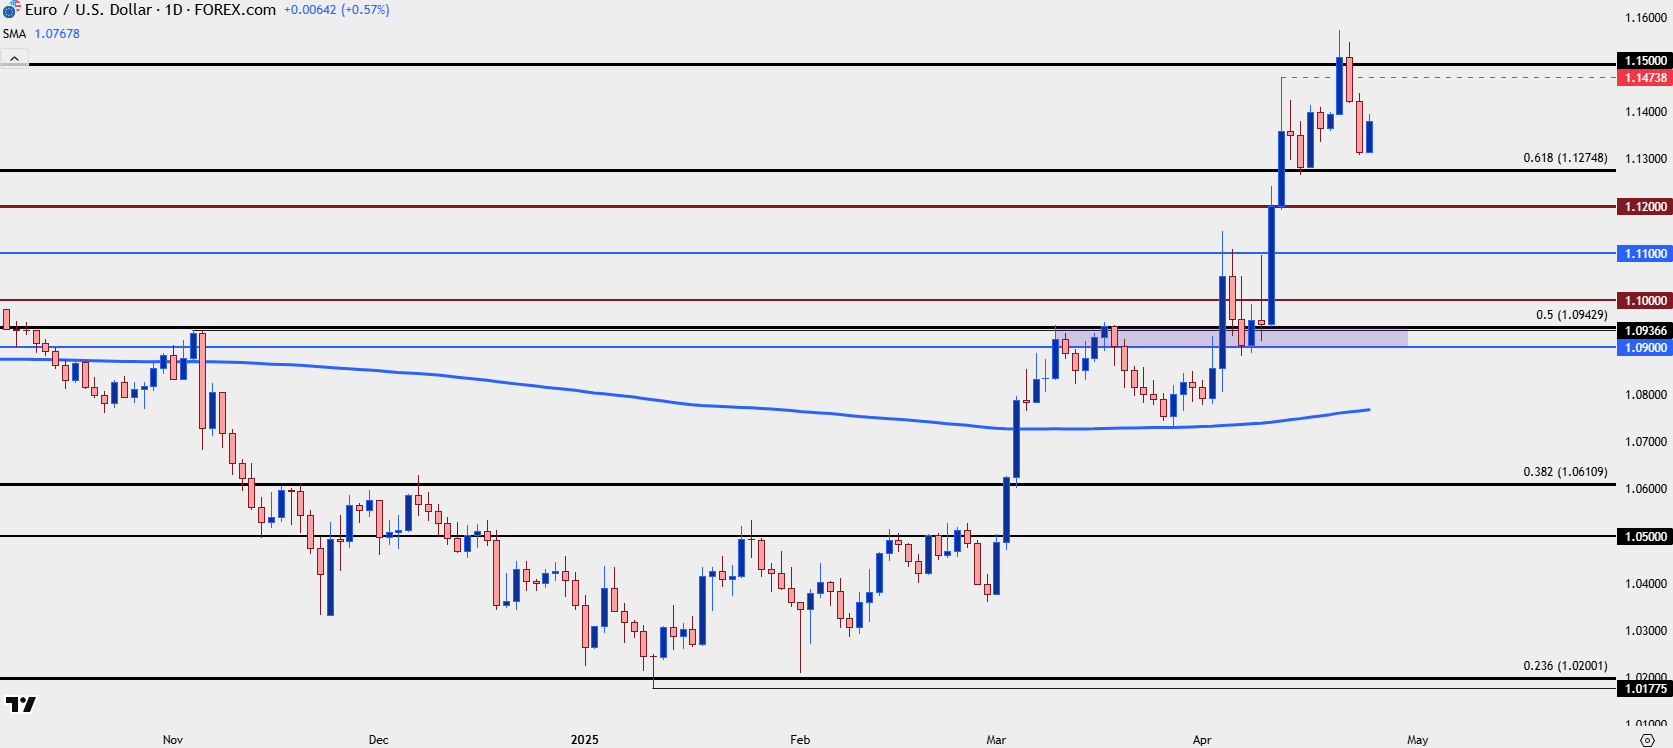 Chart prepared by James Stanley; data derived from Tradingview
--- written by James Stanley, Senior Strategist
EUR/USD Talking Points:
- EUR/USD has had a strong 2025, so far, with the pair testing below 1.0200 in January and above 1.1500 earlier this week.
- EUR/USD is now overbought on the weekly chart and this is the first such instance since the summer of 2020. This doesn’t spell automatic reversal, but it does make the prospect of chasing the trend higher as at least a bit more daunting.
Coming into the year parity calls were widespread as EUR/USD was selling off with a full head of steam. The pair attempted a bounce in early December after the post-election sell-off, but sellers stood at the ready to offer resistance at 1.0611, and that extended the downside move through the first two weeks of the new year.
But that’s around when support began to show up, and it wasn’t a fast turn as reversals often aren’t, but it was gyration in the month of February that started to open the door for a bigger picture reversal in the pair.
Interestingly, the tariff topic had some sway on both sides of the matter. In February, tariffs were a USD-positive item and deductively, that was EUR/USD negative. The first mention of tariffs on Europe after the inauguration happened on the first weekend of February, and this provided a shock to EUR/USD but notably, the pair held a higher-low. For the rest of the month the 1.0500 level remained as resistance, but by the time March rolled around, there were growing fears of recession in the U.S. and suddenly, tariffs were a USD-negative item.
This led to one of the strongest breakouts ever seen in EUR/USD in the first month of March, with the pair hurriedly jumping up to the 1.0943 level, which is the 50% mark of the same Fibonacci retracement that caught the lows in January at the 23.6. The pullback from that remained somewhat shallow, with the 200-day moving average coming in to hold the lows before buyers took another significant step forward with the breakout in April which was, once again, fueled by tariff concerns that brought a USD-negative appeal.
EUR/USD Weekly Chart
Chart prepared by James Stanley; data derived from Tradingview
EUR/USD Overbought
From the weekly chart above you can see the RSI reading in overbought territory, which is somewhat of a rare occurrence for the pair. The last instance of such is all the way back in 2020 when the USD was surging lower on the back of the Fed’s response to the Covid pandemic. And just as I had highlighted in yesterday’s webinar, this is not an automatic push for reversal – and that prior instance illustrates that as it took the pair another four months to top before ultimately going into a strong reversal in 2021 and 2022.
But – it does highlight the challenge of chasing an already well-priced in move, and this can make breakout strategies as a less attractive way of working with the pair. Support, however, can remain of interest for higher-lows as that’s the point that bulls are on the spot to defend the trend. And it’s as that defense begins to wane or recede that a larger reversal can become more attractive.
We’ve already seen this play out to a degree as the overbought reading showed up last week and a pullback to the Fibonacci level at 1.1275 brought bulls back in for an extension of the move. That would remain a viable support level especially if there was respect of last week’s swing low at 1.1264. Below that, the 1.1200 level remains of interest as this was a brick wall of resistance last year, holding multiple episodes of resistance before the Q4 reversal took over. And there’s even a case for the 1.1100 handle, as this was resistance earlier in April but, to date, hasn’t been tested for support.
If that level does come into play, however, there could then be a setup for a lower-high that could begin to open the door for larger reversal themes, but at this point we have to consider it as support until proven otherwise.
EUR/USD Daily Price Chart
Chart prepared by James Stanley; data derived from Tradingview
--- written by James Stanley, Senior Strategist
Latest market news
September 18, 2025 02:48 PM
June 23, 2025 01:22 PM
June 23, 2025 10:39 AM
June 20, 2025 05:23 PM
June 20, 2025 04:46 PM
June 20, 2025 03:35 PM

June 9, 2025 03:52 PM

June 6, 2025 05:41 PM

May 21, 2025 07:02 PM

May 20, 2025 06:58 PM