

Key Developments:
- China retaliates with 125% tariffs on US goods, stating it’s the highest level they intend to impose
- DXY drops to 3-year lows below 100, pushing EURUSD to 1.1470 and USDJPY to 142
- Major US bank earnings are due today, introducing the final wave of volatility before the weekend amid trade-related headlines
- Monetary policy decisions kick off next week, beginning with the Bank of Canada (BoC) on Wednesday and the European Central Bank (ECB) on Thursday, as markets navigate dollar weakness and trade war turbulence
China has announced a sharp escalation in the trade conflict, raising tariffs on US goods to 125% starting April 12. In response, the Dollar Index (DXY) dropped below the psychological 100 level, sending EURUSD above 1.14 and USDJPY down to 142 ahead of major US bank earnings scheduled for release today.
Given the magnitude of the tariff shock, the following charts break down the Dollar Index (DXY), EURUSD, and USDJPY trends on both monthly and weekly time frames.
DXY Monthly Time Frame – Log Scale

Source: Tradingview
The long-standing uptrend channel on the Dollar Index, extending from the 2008 lows, is now under threat as the index trades below the mid-channel zone. DXY is hovering near 2023 lows, with downside risks toward the lower boundary of the channel.
Key support levels to watch lie at 98, 96, and 94. On the upside, if 98 holds, the DXY could attempt to recover toward 101.30, 103.30, and 105, though a clean break above these is needed to confirm a sustained bullish reversal. Weakness in the DXY is lifting major USD pairs like the euro and pound.
While GBPUSD trades below its 2024 high of 1.3434, following a UK GDP improvement from 0.0% to 0.5%, EURUSD surged to test its 2022 peak near 1.1470. Meanwhile, USDJPY declined to 142, just above key supports near the 140 mark and 2024 lows.
EURUSD Forecast: Monthly Time Frame – Log Scale
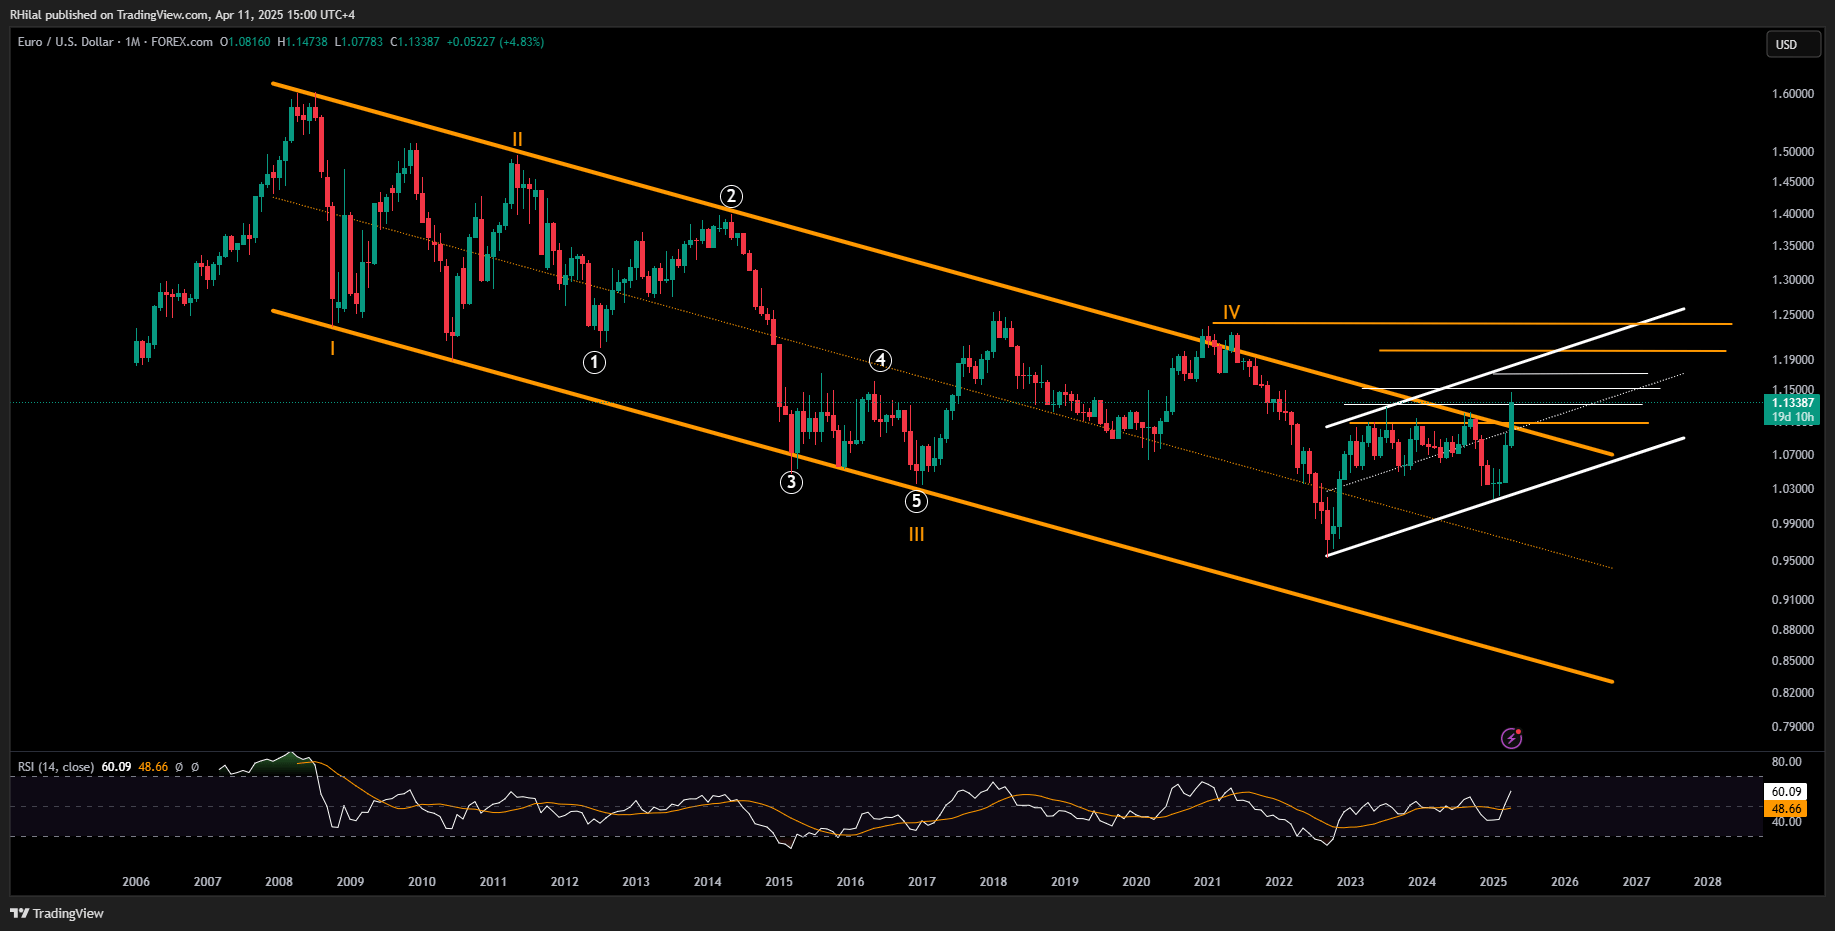
Source: Tradingview
With the 3-Day RSI hovering near 2020 highs, the monthly chart shows potential for further upside as EURUSD breaks out of a long-term downtrend channel that began from the 2008 highs. The pair has reached a high of 1.1470, aligning with the 0.272 Fibonacci retracement of the 2008–2022 downtrend.
A sustained hold above 1.15 opens the door for further gains toward resistance levels at 1.1730, 1.20, and 1.2350. On the downside, if overbought conditions on lower time frames lead to a pullback below 1.1270, potential support levels to monitor include 1.1400, 1.0940, and 1.0850.

USDJPY Weekly Time Frame – Log Scale
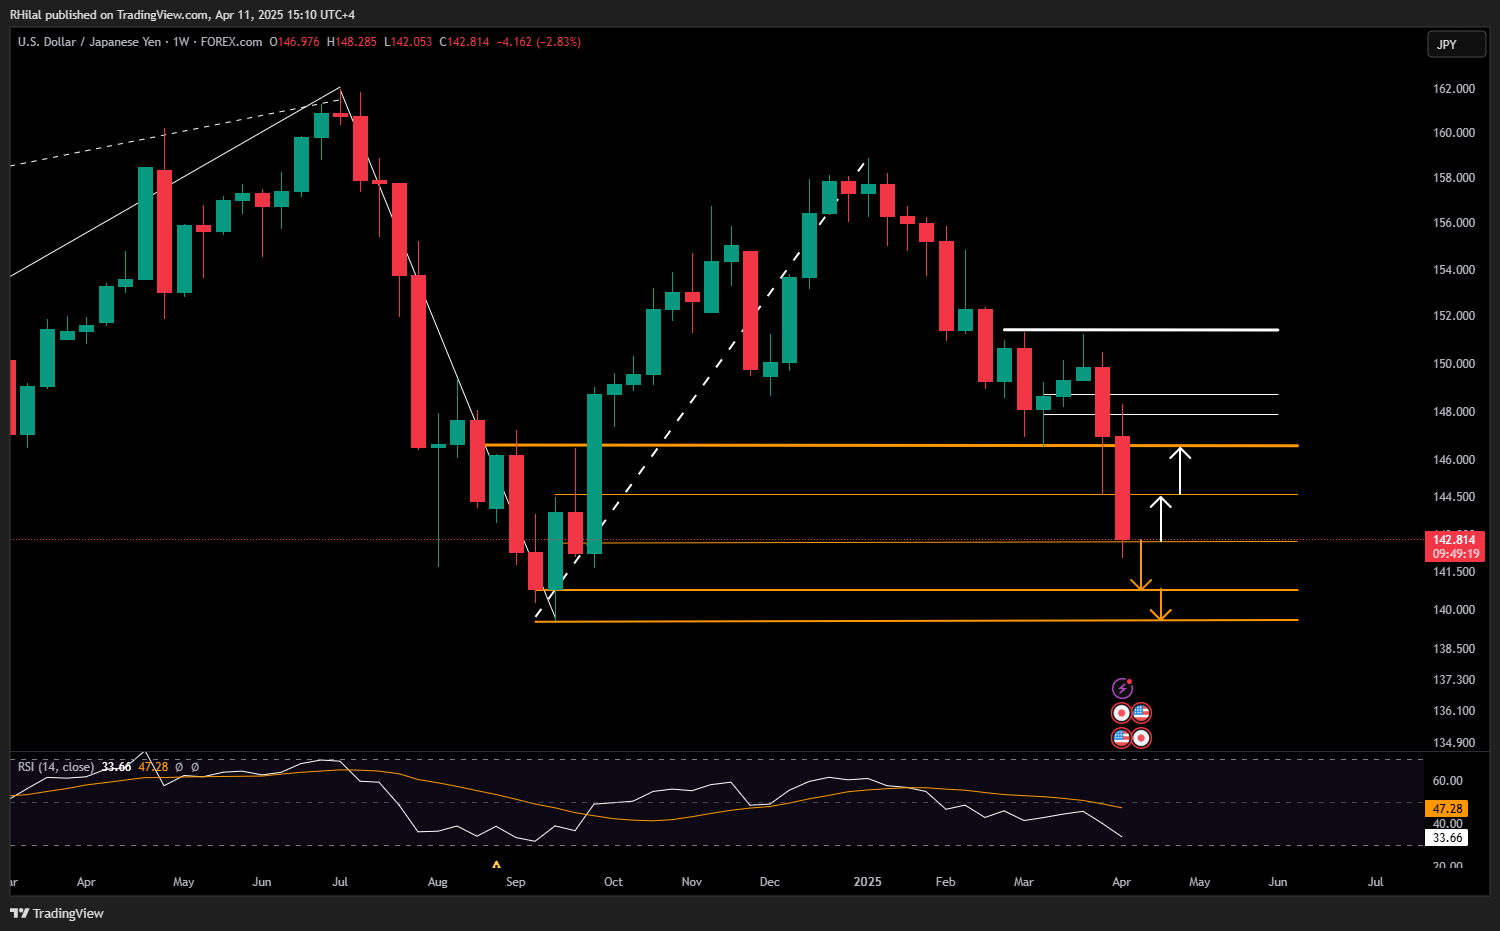
Source: Tradingview
From a weekly perspective, USDJPY is under pressure, risking a deeper drop below the key 140 zone, which marks the 2024 low.
Currently hovering above 142, a break below this level may open the path toward 140.70 and 139.60, possibly extending to lows last seen in 2023. If the pair manages to hold above 142, it could rebound toward 144.60 and 146.60, with room to revisit 150 and beyond if momentum builds.

Written by Razan Hilal, CMT
Follow on X: @Rh_waves
Latest market news

April 25, 2025 09:13 AM

April 11, 2025 12:00 PM

April 4, 2025 12:30 PM

March 28, 2025 12:00 PM