

Weekly Technical Trade Levels on USD Majors, Commodities & Stocks
- Technical setups we are tracking into the weekly open
- Next Weekly Strategy Webinar: Monday, June 23 at 8:30am EST
- Review the latest Video Updates or Stream Live on my YouTube playlist.
In this webinar we take an in-depth look at the technical trade levels for the US Dollar (DXY), Euro (EUR/USD), British Pound (GBP/USD), Australian Dollar (AUD/USD), Canadian Dollar (USD/CAD), Japanese Yen (USD/JPY), Swiss Franc (USD/CHF), Gold (XAU/USD), Silver (XAG/USD), Crude Oil (WTI), S&P 500 (SPX500), Nasdaq (NDX), and the Dow Jones (DJI). These are the levels that matter on the technical charts into the weekly open.
US Dollar Price Chart – USD Weekly (DXY)
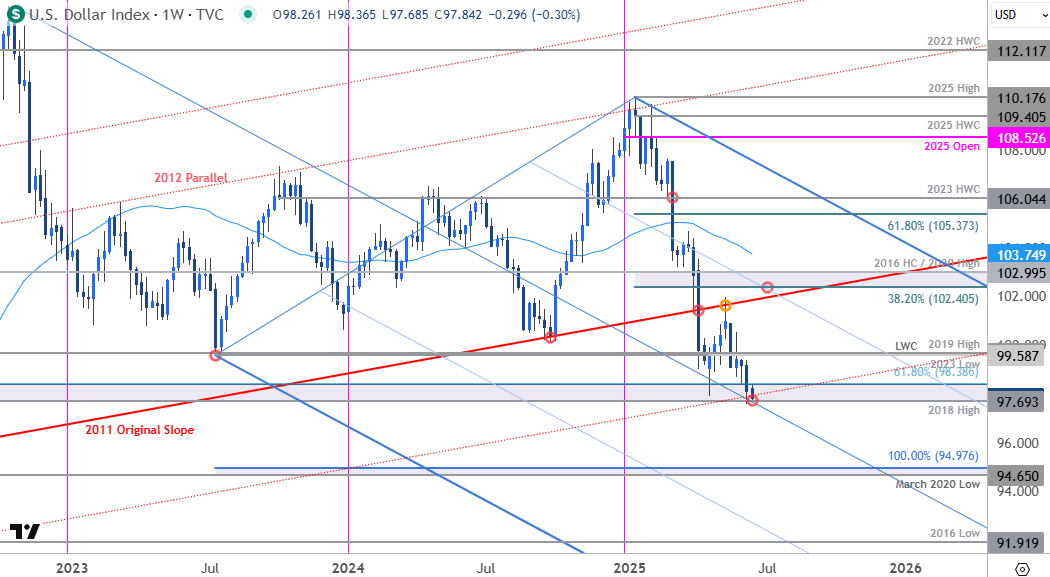
Chart Prepared by Michael Boutros, Sr. Technical Strategist; DXY on TradingView
The U.S. Dollar Index is trading into a critical support pivot into the start of the week at 97.69-98.38- a region defined by the 2018 swing high, the April lows, and the 61.8% of the 2018 advance. Note that the median-line converges on this threshold over the next week and further highlights the technical significance of this zone. Risk for possible downside exhaustion / price inflection into this threshold- a break / close below would threaten another bout of accelerated losses with subsequent objectives eyed at the 96-handle and 94.65/98. Resistance / near-term bearish invalidation set to the April low week close (LWC) / 2019 high / 2023 low at 99.58.
The FOMC interest rate decision is on tap Wednesday and traders will be focused on the updated economic projections on growth, employment, and inflation. Stay nimble into the release and watch the weekly close here for guidance. Review my latest US Dollar Short-term Outlook for a closer look at the near-term DXY technical trade levels.

Canadian Dollar Price Chart – USD/CAD Weekly
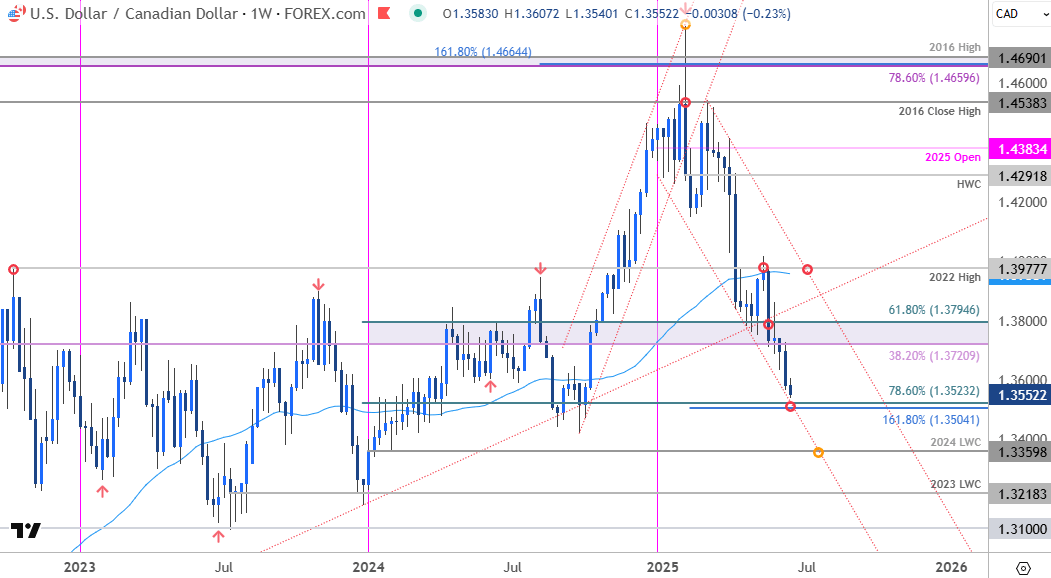
Chart Prepared by Michael Boutros, Sr. Technical Strategist; USD/CAD on TradingView
USD/CAD broke below key support last week with price attempting to mark a third consecutive weekly loss. A break of multi-year uptrend threatens further losses here with confluent support now within striking distance at 1.3504/23- a region defined by the 1.618% extension of the February decline and the 78.6% retracement of the late-2023 advance. Note that channel support converges on this threshold over the next few weeks- risk for possible exhaustion / price inflection into this zone. Resistance now back at 1.3720/95 with bearish invalidation steady at 1.3958/77. A break below this pivot zone exposes the 2024 LWC at 1.3360 and the 2023 LWC at 1.3218. Review my latest Canadian Dollar Short-term Outlook for a closer look at the near-term USD/CAD technical trade levels.
Economic Calendar – Key USD Data Releases
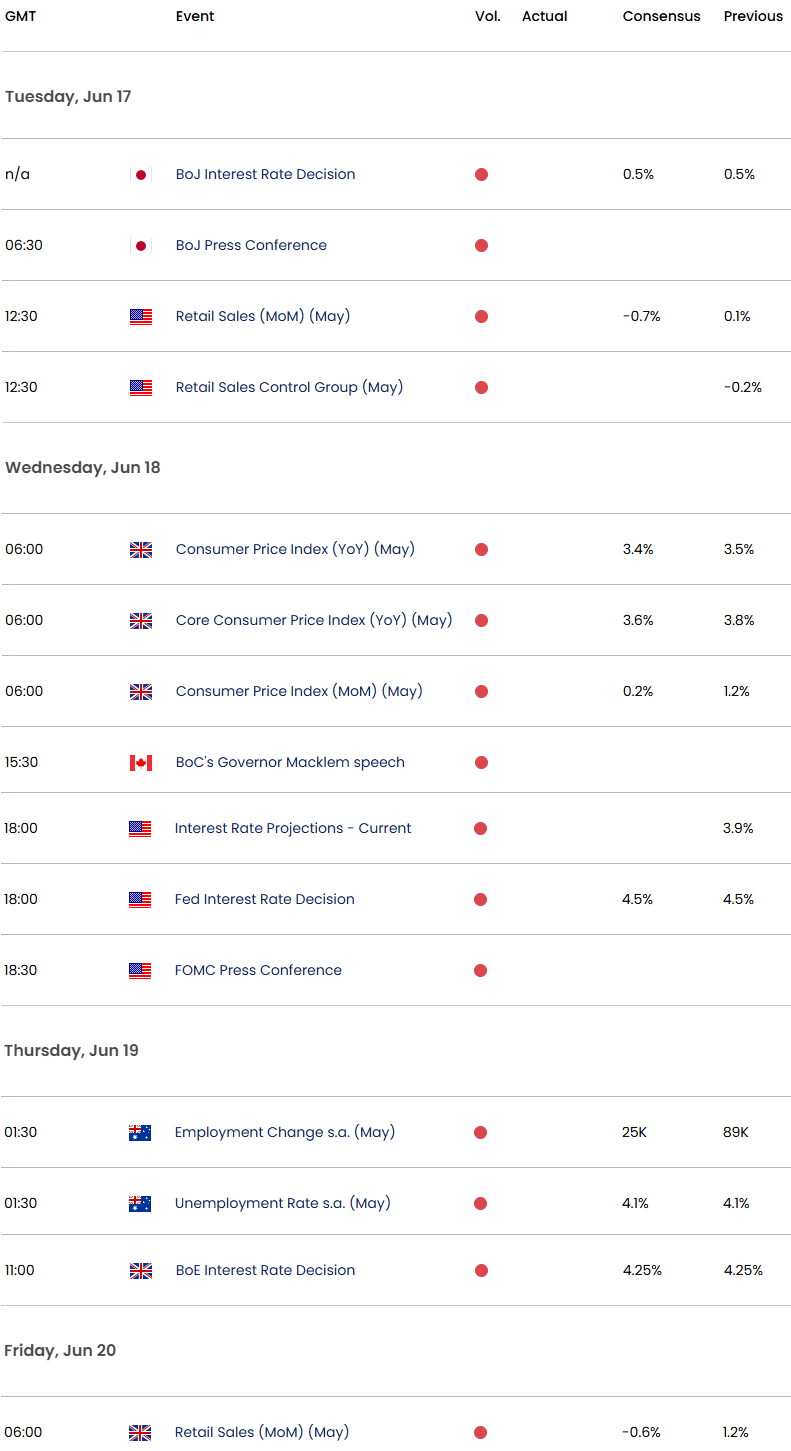
Economic Calendar - latest economic developments and upcoming event risk.
--- Written by Michael Boutros, Sr Technical Strategist
Follow Michael on X @MBForex
Latest market news
September 18, 2025 02:48 PM
June 23, 2025 01:22 PM
June 23, 2025 10:39 AM
June 20, 2025 05:23 PM
June 20, 2025 04:46 PM
June 20, 2025 03:35 PM

June 9, 2025 03:52 PM

June 6, 2025 05:41 PM

May 21, 2025 07:02 PM

May 20, 2025 06:58 PM