

Key Events to Watch:
- FOMC Minutes & NVIDIA Earnings
- U.S. GDP Second Estimate (Thursday)
- BOE Governor Bailey’s Speech (Thursday)
- U.S. Core PCE Price Index (Friday)
GBPUSD Forecast: Weekly Time Frame – Log Scale

Source: Tradingview
The GBP/USD pair is currently testing a key resistance zone and trendline stretching from the peaks of July 2023 to September 2024. These levels coincide with previously oversold RSI readings seen during the same periods, raising the likelihood of a pullback.
This resistance aligns with the 1.36 level, which also corresponds to the 1.272 Fibonacci extension of the long-term downtrend from the 2008 highs to the 2022 lows. A clean break and sustained move above this level could open the way for further gains, targeting the 0.382 retracement zone and the previous highs from 2021 and 2016, between 1.42 and 1.47.
On the downside, if a pullback emerges—driven by overbought conditions or renewed dollar strength—a clear break below 1.3460 could extend selling pressure toward 1.33, 1.3240, and 1.3140.
Dow Jones Forecast: Weekly Time Frame – Log Scale
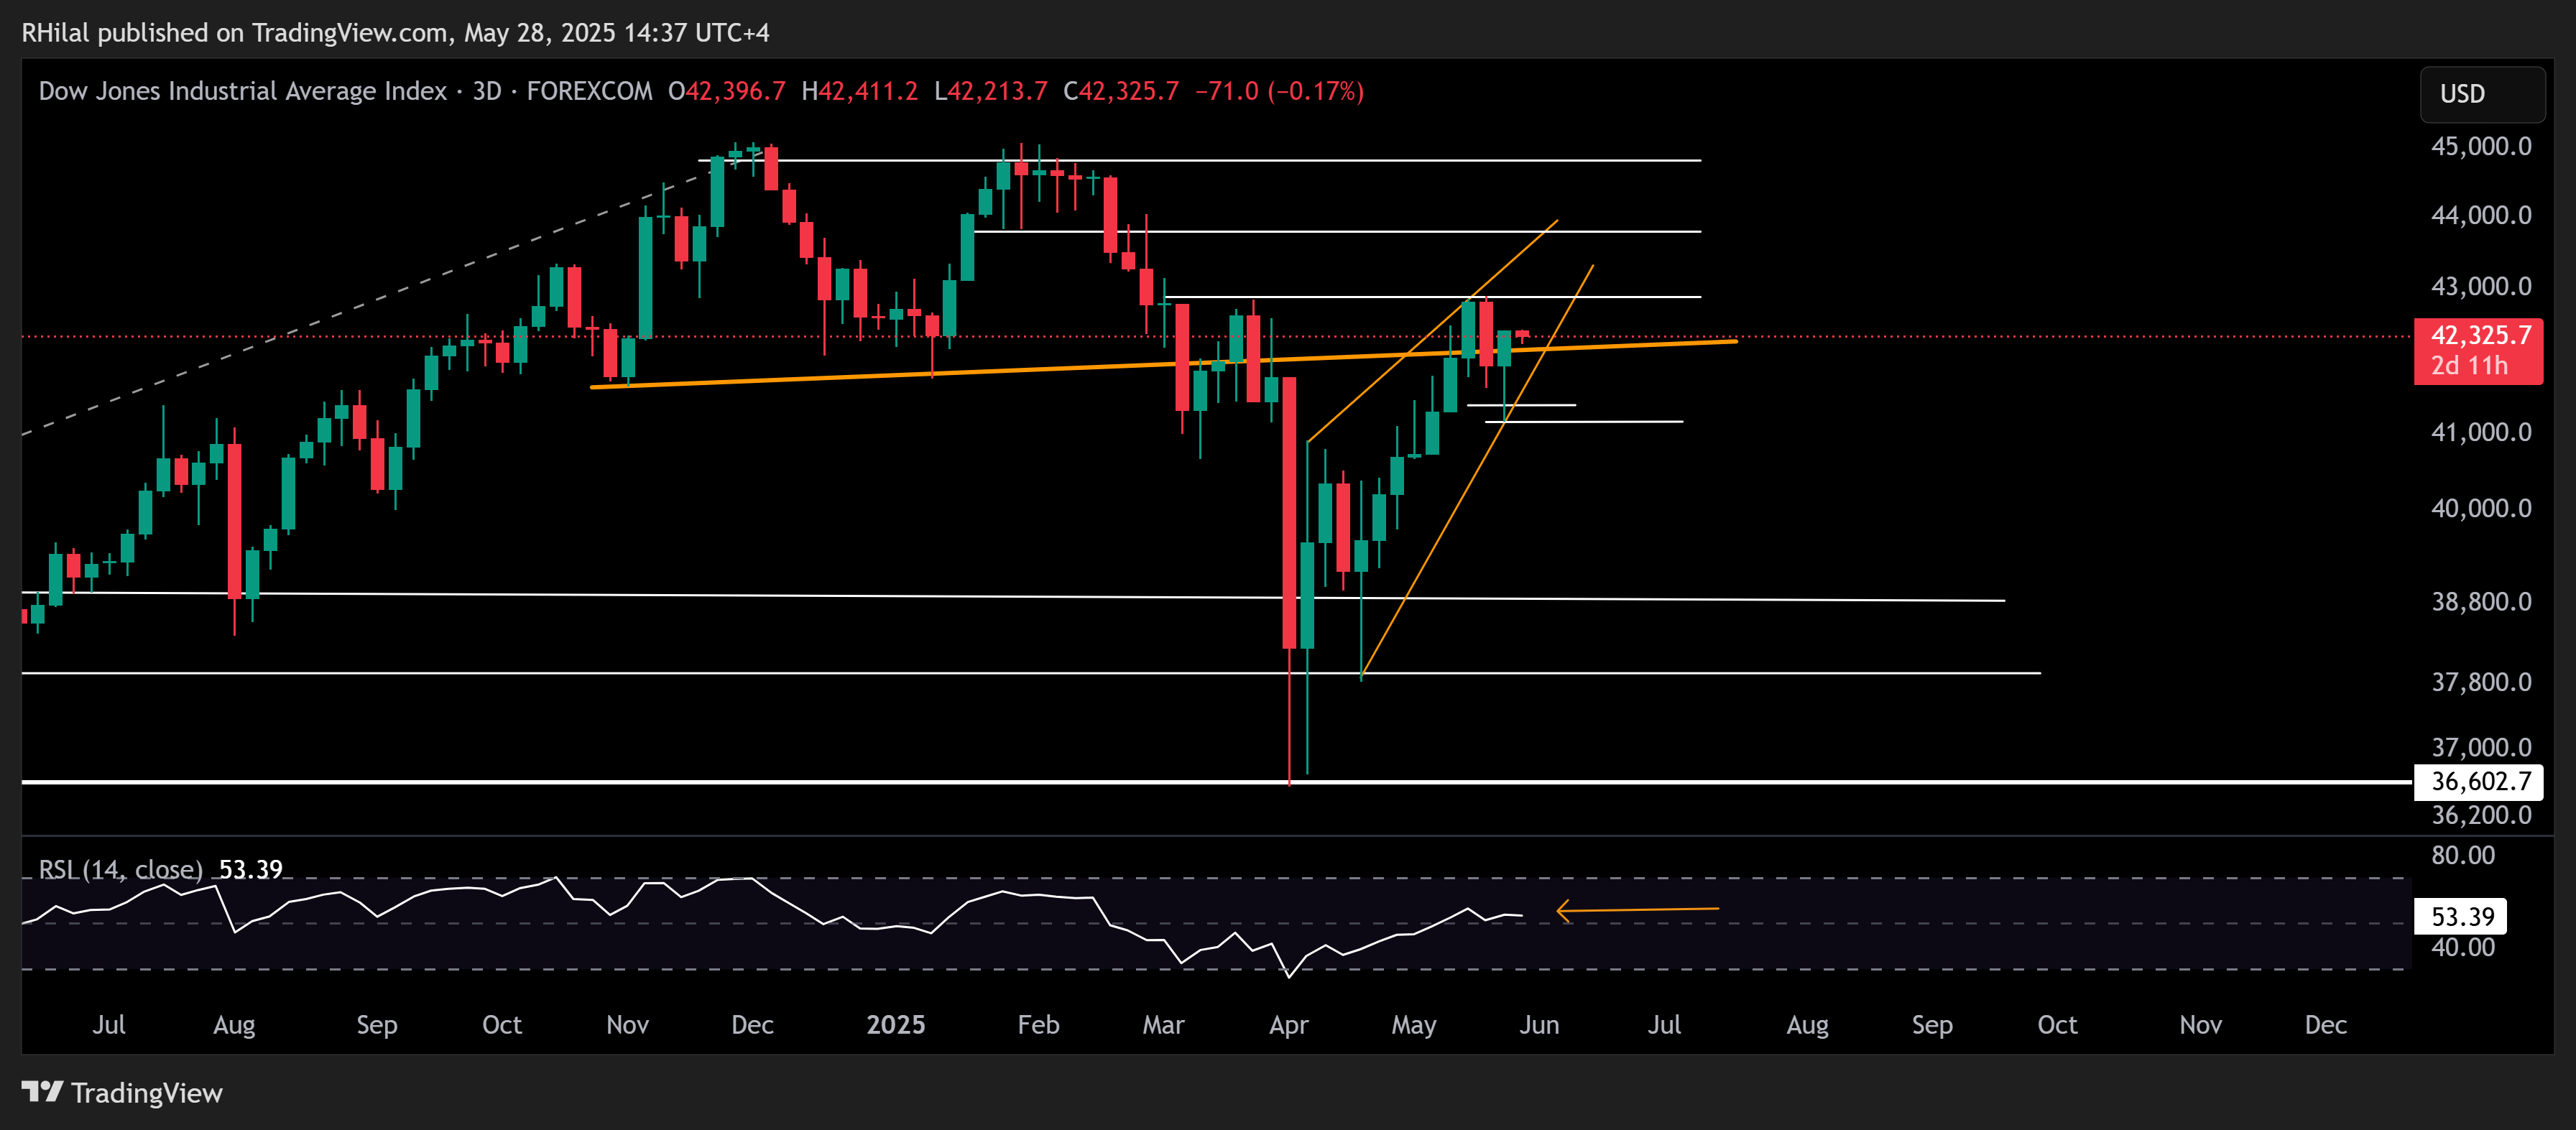
Source: Tradingview
The Dow is currently holding near the neckline of a double-top formation that developed between December 2024 and February 2025, possibly buoyed by ongoing tech and Nasdaq optimism. The broader rebound from the 2025 lows is also forming a diagonal structure, setting up the following scenarios:
Bullish Scenario:
With weekly RSI holding above the 50 neutral zone after rebounding from oversold levels last seen in 2020, a sustained move above the 42,400 and 42,800 resistance levels could extend the rally toward 43,800 and 44,800. A breakout above the all-time high near 45,000 would open the door toward the next major resistance at 46,800.
Bearish Scenario:
If the diagonal formation breaks to the downside—below 41,400 and 41,000—selling pressure could resume, forming a diagonal correction targeting support levels at 40,400, 39,700, and 39,000.

Written by Razan Hilal, CMT
Follow on X: @Rh_waves
Latest market news
September 18, 2025 02:48 PM
June 23, 2025 01:22 PM
June 23, 2025 10:39 AM
June 20, 2025 05:23 PM
June 20, 2025 04:46 PM
June 20, 2025 03:35 PM

February 10, 2025 08:45 PM

February 1, 2025 02:00 AM

January 1, 2025 07:30 AM

December 23, 2024 02:45 PM