

British Pound Outlook: GBP/USD
GBP/USD climbs to a fresh yearly high (1.3252) as it stages a six-day rally for the first time in 2025, and the exchange rate may attempt to test the October high (1.3390) as it appears to be tracking the positive slope in the 50-Day SMA (1.2801).
GBP/USD Stages Six-Day Rally for First Time in 2025
GBP/USD continues to carve a series of higher highs and lows after testing the moving average during the previous week, with the bullish price series pushing the Relative Strength Index (RSI) towards overbought territory.
Join David Song for the Weekly Fundamental Market Outlook webinar.
David provides a market overview and takes questions in real-time. Register Here
In turn, a move above 70 in the RSI is likely to be accompanied by a further rise in GBP/USD like the price action from earlier this year, but the oscillator may show the bullish momentum abating should it struggle to push into overbought territory.
UK Economic Calendar

Looking ahead, the update to the UK Consumer Price Index (CPI) may sway GBP/USD as the headline and core reading are expected to narrow in March, and signs of slowing inflation may encourage the Bank of England (BoE) to further unwind its restrictive policy as the central bank acknowledges that ‘there has been substantial progress on disinflation over the past two years.’
Meanwhile, a higher-than-expected UK CPI report may keep the BoE on the sidelines as ‘monetary policy will need to continue to remain restrictive for sufficiently long until the risks to inflation returning sustainably to the 2% target in the medium term have dissipated further,’ and indications of persistent price growth may keep GBP/USD afloat as it curbs speculation for lower UK interest rates.
With that said, the British Pound may continue to appreciate against its US counterpart as seems to be tracking the positive slope in the 50-Day SMA (1.2801), but the exchange rate may consolidate over the coming days should it snap the series of higher highs and lows carried over from last week.
GBP/USD Price Chart –Daily
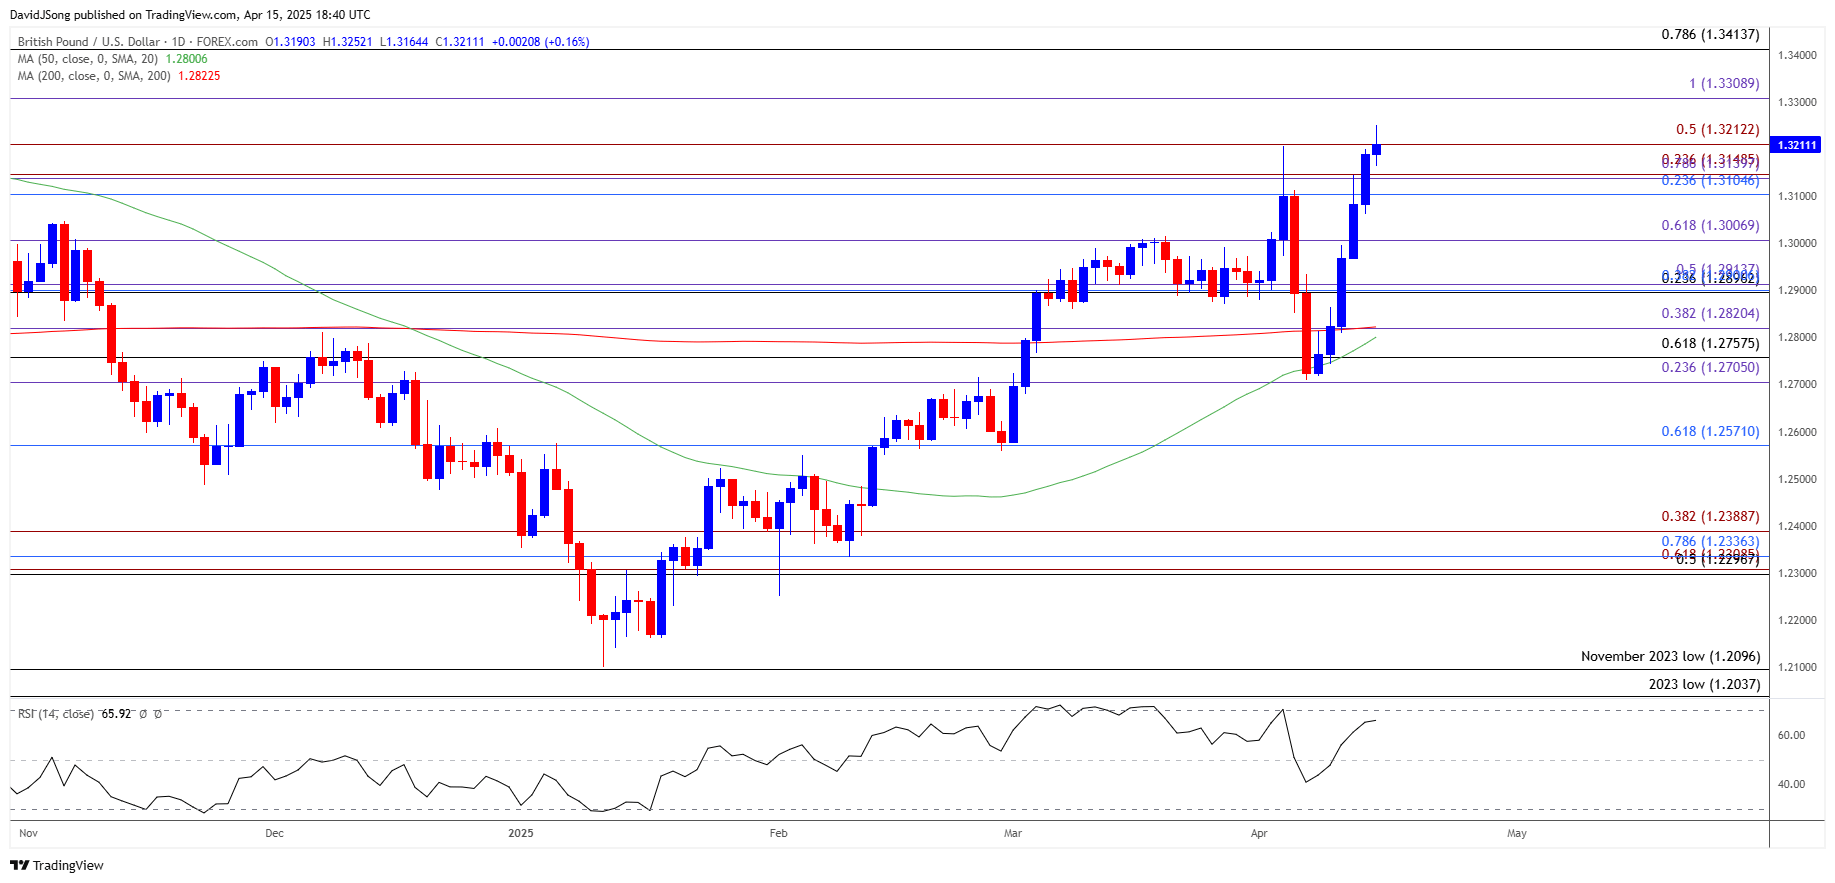
Chart Prepared by David Song, Senior Strategist; GBP/USD on TradingView
- GBP/USD rallies to a fresh yearly high (1.3252) following the failed attempt to break/close below the 1.2710 (23.6% Fibonacci extension) to 1.2760 (61.8% Fibonacci retracement) zone, and a break/close above 1.3310 (100% Fibonacci extension) may push the exchange rate towards the October high (1.3390).
- Next area of interest comes in around 1.3410 (78/6% Fibonacci retracement), but lack of momentum to close above 1.3210 (50% Fibonacci extension) may curb the six-day rally in the exchange rate.
- A move/close below the 1.3110 (23.6% Fibonacci retracement) to 1.3150 (23.6% Fibonacci extension) zone may push GBP/USD back towards 1.3010 (61.8% Fibonacci extension), with the next area of interest coming in around 1.2900 (23.6% Fibonacci retracement) to 1.2910 (50% Fibonacci extension).
Additional Market Outlooks
USD/JPY Defends Monthly Low to Keep RSI Above 30 for Now
AUD/USD Stages Four-Day Rally to Eye Monthly High
Canadian Dollar Forecast: USD/CAD Faces BoC Meeting Ahead of Canada Election
Euro Forecast: EUR/USD Clears 2024 High to Push RSI into Overbought Zone
--- Written by David Song, Senior Strategist
Follow on Twitter at @DavidJSong

Latest market news
September 18, 2025 02:48 PM
June 23, 2025 01:22 PM
June 23, 2025 10:39 AM
June 20, 2025 05:23 PM
June 20, 2025 04:46 PM
June 20, 2025 03:35 PM

June 9, 2025 03:52 PM

June 6, 2025 05:41 PM

May 21, 2025 07:02 PM

May 20, 2025 06:58 PM