

- Gold consolidates break above $3,000
- Silver pullback forms bullish wedge, hinting at upside potential
- Momentum signals are mixed, but bullish bias remains intact for both metals
Summary
Both gold and silver have fallen over the past week, pulling back after a breakneck rally to start the year. While firmer risk appetite, rising bond yields, and a stronger U.S. dollar are popular narratives to explain the latest price movements, correlation analysis suggests other factors may be driving the unwind. With a quiet economic calendar and quarter-end fast approaching, price signals loom as good a guide as any for traders seeking fresh setups.

Gold Consolidates $3000 Break
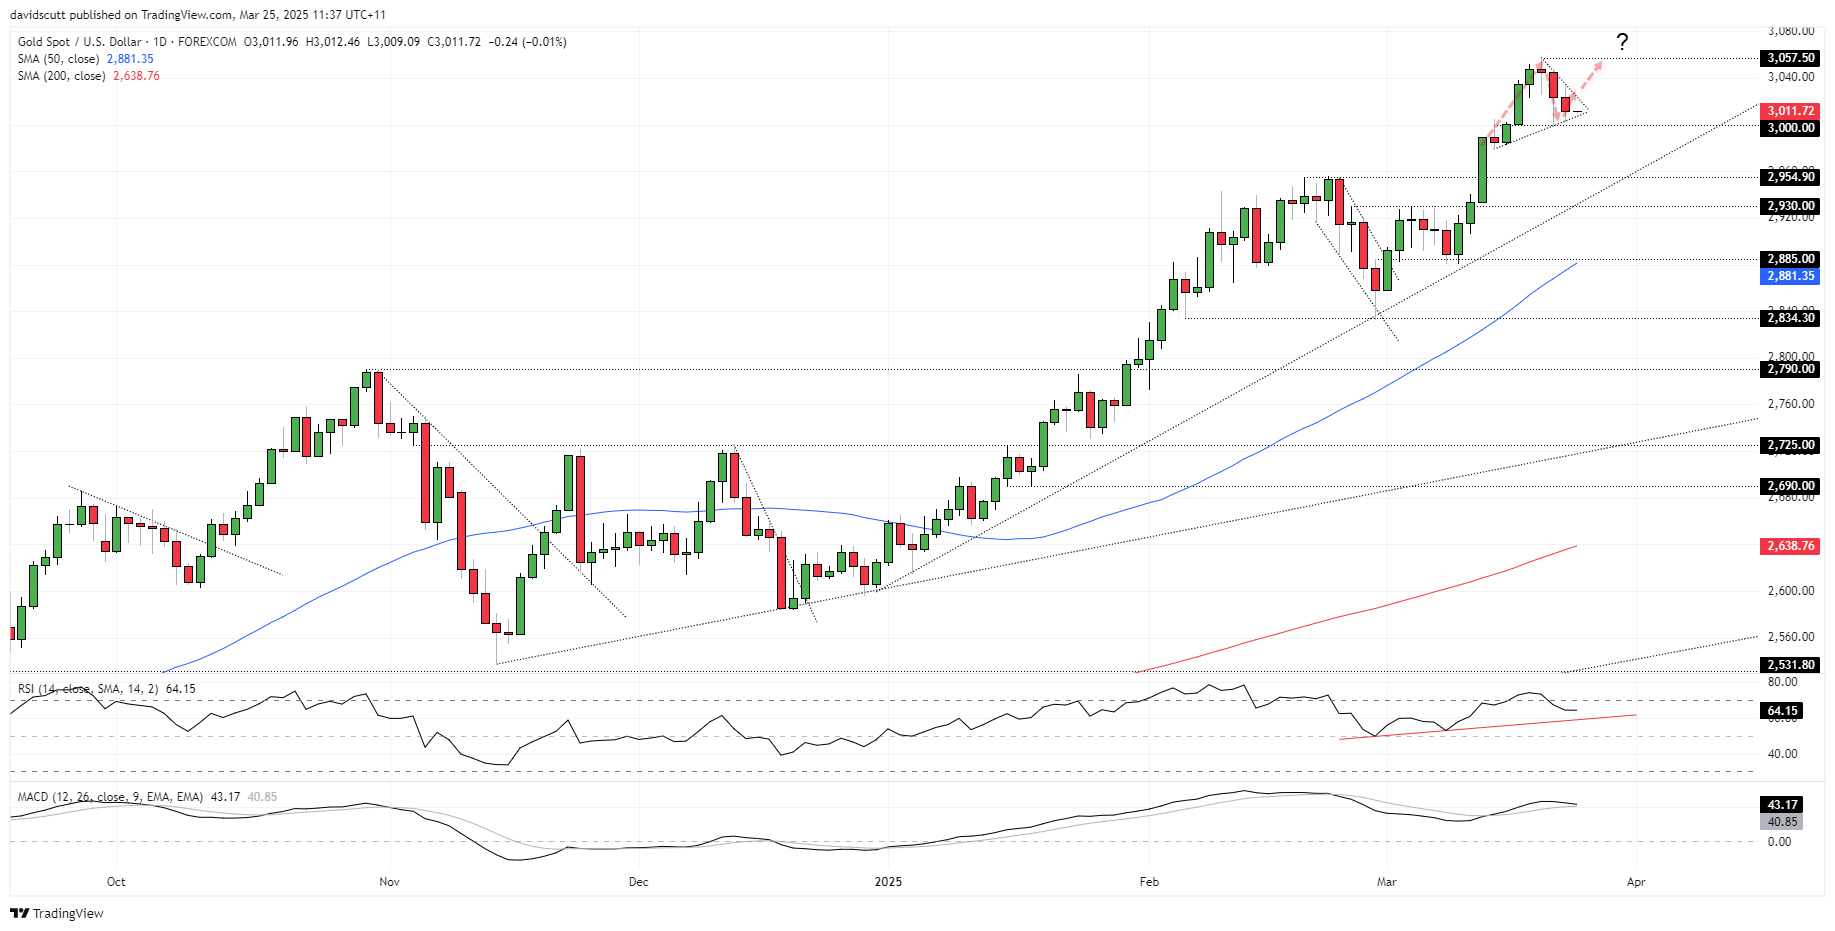
Source: TradingView
Gold remains a buy-on-dips play despite the recent pullback, not only holding above the key $3,000 level but also the 50 and 200-day moving averages and the uptrend established in late December. For now, momentum indicators continue to generate bullish signals, although MACD is starting to look heavy, approaching the signal line from above. Nearer-term, the latest pullback has seen price coil up in what resembles a triangle pattern, with Tuesday shaping up as a potentially pivotal session as price sits at the intersection of the uptrend and downtrend. Having entered from below, a topside break screens as more likely if there’s to be a definitive move.
Support is found at $3,000, with $2,954.90 the next level after that. On the topside, a break of triangle resistance would open the door for a move back toward the record high of $3,057.50 set last week.

Silver Bias Remains to Buy Dips
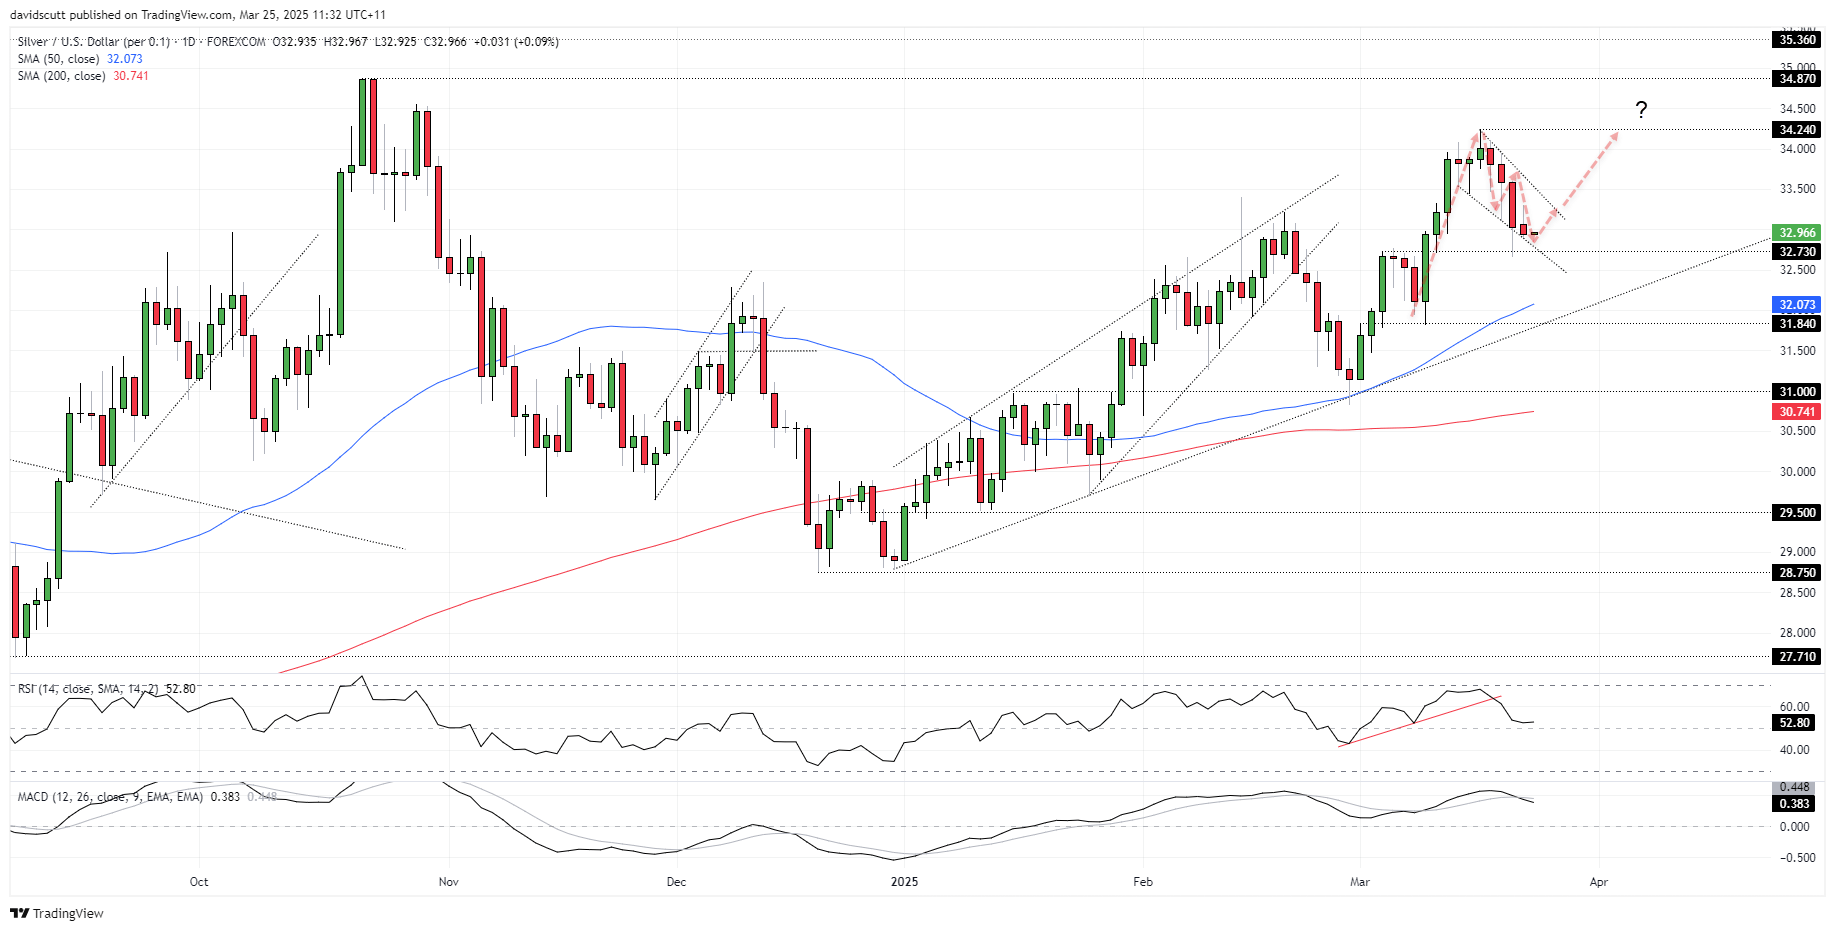
Source: TradingView
Silver’s break above $33 earlier this month flamed out above $34, putting a retest of the October swing high on hold for now. While momentum indicators like RSI (14) and MACD are generating bearish signals—favouring near-term downside—the preference remains to buy dips, with silver trading above both its 50 and 200-day moving averages and uptrend support established late last year. The recent pullback also resembles a falling wedge pattern, suggesting traders should be alert to the risk of a topside break and resumption of the broader bullish trend.
Support is found at $32.73 and $31.84. Resistance may be encountered above $33.50 and $34, with a break above the March 18 high of $34.24 opening the path for a potential run toward the October 2024 highs.
-- Written by David Scutt
Follow David on Twitter @scutty
Latest market news

April 25, 2025 02:58 AM