

- Gold forecast weakens as prices slip on risk-on trade
- Trump says tariffs could be lowered if US–China trade talks progress well
- US stocks extend rally with chipmakers leading the charge, Bitcoin above $100K
The risk-on trade has just gathered pace
So, the markets are keeping their footing, supported by renewed optimism over trade negotiations—starting with a deal between the US and the UK. US stocks were testing their session highs at the time of writing as Bitcoin broke above the key $100K hurdle. Trump said China tariffs could be lowered if talks progress well, adding that 10% is probably the lowest end for a tariff. Earlier, a trade deal with the UK was announced. With stocks rising, the price of gold has pulled back on reduced haven demand. So, what does the gold forecast look like from here? While not outright bearish, I think at least some consolidation should be warranted.

Gold forecast turns mildly bearish with stocks and crypto on the rise
At the moment, the pullback in gold appears mild, with all major support levels still intact. But if risk sentiment improves further, we could see more pressure. After all, gold’s biggest driver along with central bank purchases has been haven demand amid trade war uncertainty. But with the uncertainty easing sharply, as evidenced by surging stock markets in the last few weeks, you’d think gold has some catching up to do – on the downside. As speculators start closing their long trades, we could well see a sharp drop soon. Let’s see if that motion has already started.
Technical gold forecast: bearish momentum starting to build
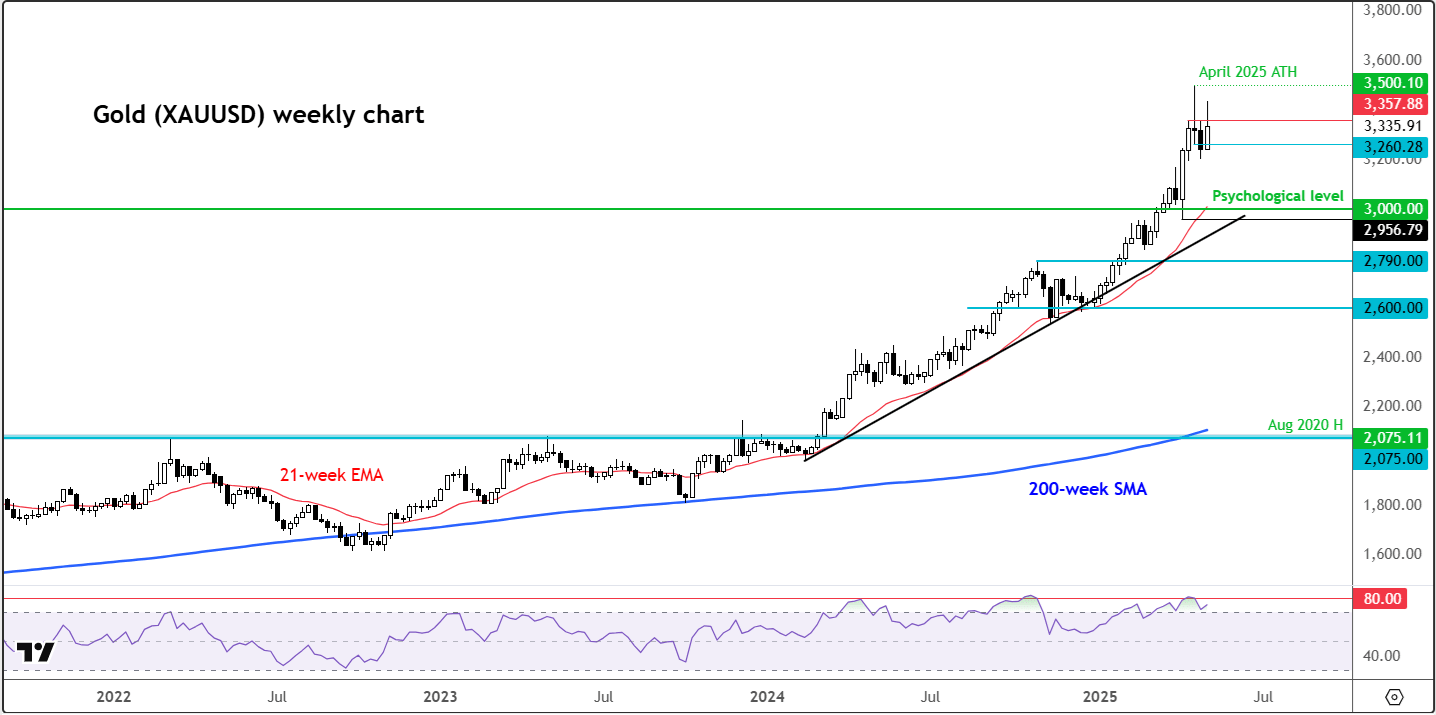
From an objective standpoint, the broader gold forecast remains broadly constructive, even though safe-haven demand has slightly weakened. Bullish traders maintain that unless we see a clear trend of lower highs and lower lows—combined with substantive progress in trade negotiations rather than more political posturing out of Washington—the door remains open for fresh highs. That said, the bearish camp also has valid arguments, as outlined earlier. With long-term gold charts flashing historically overbought momentum signals, bears are likely to step in and defend key broken support levels. In that context, the path of least resistance currently appears to be skewed to the downside.
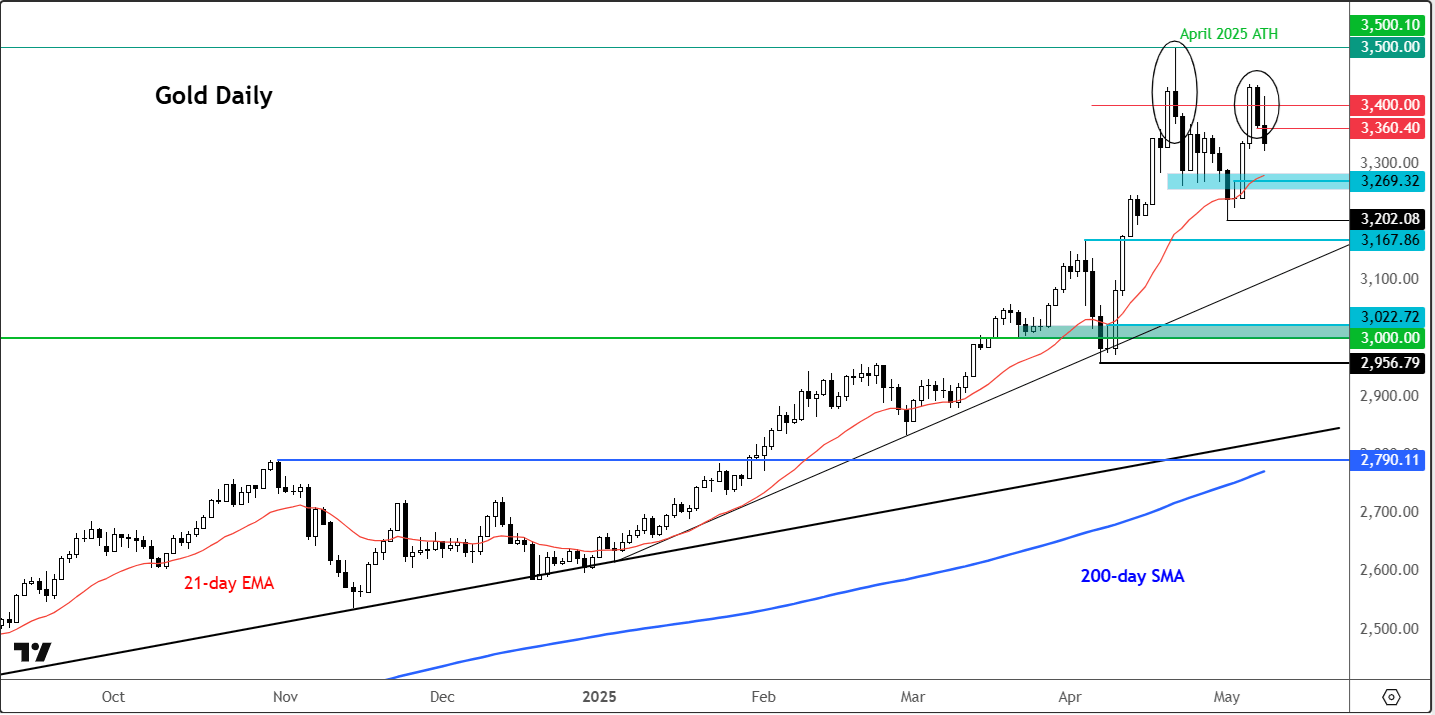
On the daily chart, we can see that gold has run into resistance in the $3,400 zone. This could act as a short-term ceiling. We're also seeing lower highs creep in, which is mildly bearish in the near term. Still, on the daily chart, gold remains in a bullish trend. For the gold forecast to turn bearish, we’d likely need to see a decisive break below $3,200, the most recent low.
XAU/USD key levels to watch
Much now depends on whether bearish momentum returns as the gold chart tests a potential support zone between $3,300 and $3,320. The next downside target is at $3,269, below which is the most recent low and the line in the sand for me at $3,202. Should that level break then $3,167, the previous breakout point from April, comes into focus.
To the upside, the first key resistance remains the $3,260 region. A convincing move above that opens the door to $3,400, followed by the all-time high of $3,500.
-- Written by Fawad Razaqzada, Market Analyst
Follow Fawad on Twitter @Trader_F_R
Latest market news
Yesterday 05:00 PM
Yesterday 04:00 PM
Yesterday 03:11 PM
Yesterday 01:35 PM

May 8, 2025 07:30 PM

May 8, 2025 04:14 PM

May 7, 2025 02:48 PM
May 6, 2025 12:52 PM