

Gold kicked off the second quarter in style, surging to fresh record highs following a standout Q1 in which it climbed a hefty 19%. However, the metal then stopped and reversed sharply, falling along with risk assets last week. The precious metal’s loss of 1.5% on the week still looks impressive given the big 13% drop in silver or the 10% decline in the Nasdaq 100. Indeed, it was a brutal second half of the week for risk assets, which tumbled across the board. The near-term gold forecast has turned a little bearish, as the metal finally reversed course.
Will gold go back below $3K?
Looking ahead to the new week, risk sentiment remains bleak, with many traders hesitant to take any positions ahead of the potential for the trade war to get even more hostile.
Many had $3,000 earmarked as their target — but with gold surpassing that target by an additional $167 meant that a bit of profit-taking always seemed inevitable.
But as I had warned before, it stocks slump that saw gold finally go down. Should equities continue to remain on the backfoot in early next week, traders might need to further liquidate their gold holdings to meet margin calls elsewhere. We have already seen some of that movement already, but it is certainly a risk worth bearing in mind in the week ahead.
Fundamentally, there are a few potential hurdles for gold — though none have materialised just yet. For instance, if geopolitical tensions ease — think Trump’s pledge to sort out Ukraine or Gaza — then the safe-haven bid for gold could ebb away. That said, there’s little evidence this peace is on the horizon.
Higher prices might also tempt miners to increase output, but supply doesn’t always ramp up quickly. Central bank demand could also ease at these elevated levels.

Technical gold forecast: Bull have lost some control
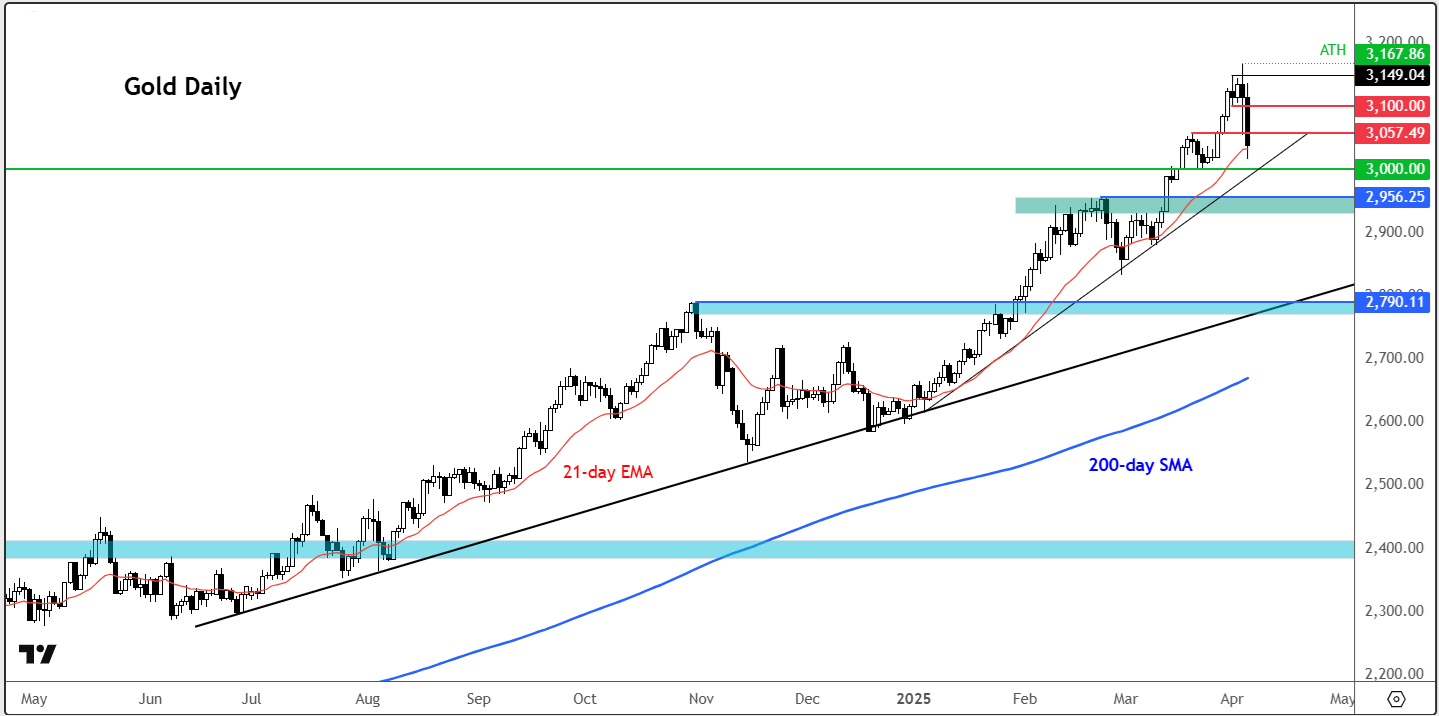
Source: TradingView.com
The gold chart has been flashing overbought signals across multiple timeframes — especially the long-term charts — so there’s the potential for the short-term selling pressure to continue for a while, keeping the gold forecast bearish.
Despite last week’s drop, the has not broken it series of higher highs and higher lows yet. But things could look different in the week ahead.
Here are a few key support levels worth watching for those dips:
- $3,000 – The big round number. Holding above this is crucial; a break below could prompt a flush towards…
- $2,930–$2,956 – The former breakout zone, making it the next strong area of interest
- $2,790 – the high from October, where the long-term bullish trend line also comes into play
On the upside, resistance seen at $3055-$3060 zone, followed by $3100.
-- Written by Fawad Razaqzada, Market Analyst
Follow Fawad on Twitter @Trader_F_R
Latest market news

April 25, 2025 04:18 PM