

Gold continues to attract eager buyers on every short-term dip, and quite frankly, it's anyone’s guess how much further this rally can run. The momentum behind the move is unmistakable, and it’s clearly deterring any meaningful selling activity from traders or longer-term investors. Against this backdrop, the gold forecast remains bullish, although prices are hitting significant overbought technical levels.

What is driving gold forecast?
Since bottoming out at $2,956 earlier this month, prices have surged nearly 18%—a striking ascent powered by a confluence of fundamental drivers. We’re looking at a textbook case of a perfect storm: ongoing global uncertainty, persistent central bank accumulation, a softer dollar, and classic safe-haven flows—all providing robust support. But the chief catalyst remains the unresolved trade tensions. The stalemate between the United States and China has created an economic haze that’s left risk assets wobbly and gold bulls confidently in the driver’s seat. President Trump’s sharp rhetoric towards the Federal Reserve and his renewed tariff threats have only intensified the appeal of gold as a protective hedge. Now, of course, a genuine breakthrough on the trade front could take some of the shine off. But with nothing more than broad platitudes coming out of the talks so far, the market has little reason to adjust course. Until we see substance over sentiment, the strategy of buying dips appears set to continue, keeping a positive gold forecast. That said, at $3,500, gold is hardly a bargain. The risk of a pullback looms large should optimism return to equity markets. But given the sheer strength of this trend, any correction is unlikely to be gentle or clean-cut.
If gold falls, don’t expect it to go down in a straight line
Should gold finally decide it’s had enough of the high life, don’t expect it to tumble in one graceful swoop. It never does. Just as the sea doesn’t retreat in a single wave, gold’s retreat—if it even begins—will likely feature all the usual stops: retracements, rallies, and a bit of investor denial. Those anticipating a grand capitulation may be in for a wait.
The prevailing trend is nothing short of robust, and for the time being, buying the dip remains the favoured pastime. Should we encounter a correction, it’ll likely offer ample opportunity for the bulls to reassess their positions and for the bears to finally have a proper swing. But let’s not get ahead of ourselves—there’s no sign of the tide turning yet.
Technical gold forecast: Frothy, but still flowing
Technically speaking, gold is marching confidently along a bullish path. There’s no debating that. But the RSI—along with other momentum gauges—is now issuing what might politely be called a raised eyebrow. The daily RSI reading is pushing 80, well into overbought territory. Still, this isn’t necessarily a sign of impending doom. It merely confirms what we already know: buyers are dominant.
So, are we nearing the top? Possibly. But I’m not ringing the bell just yet. These elevated indicators serve more as a caution than a call to arms. It’s less “get out” and more “stay sharp.”
XAU/USD technical levels to watch
Gold’s climb to a record $3,500 has been impressive, but predictably, it’s begun to retreat ever so slightly from this psychological peak—likely due to some routine profit-taking. There’s no natural resistance above this level; round numbers are all we’ve got. On the way down, however, the story is different.
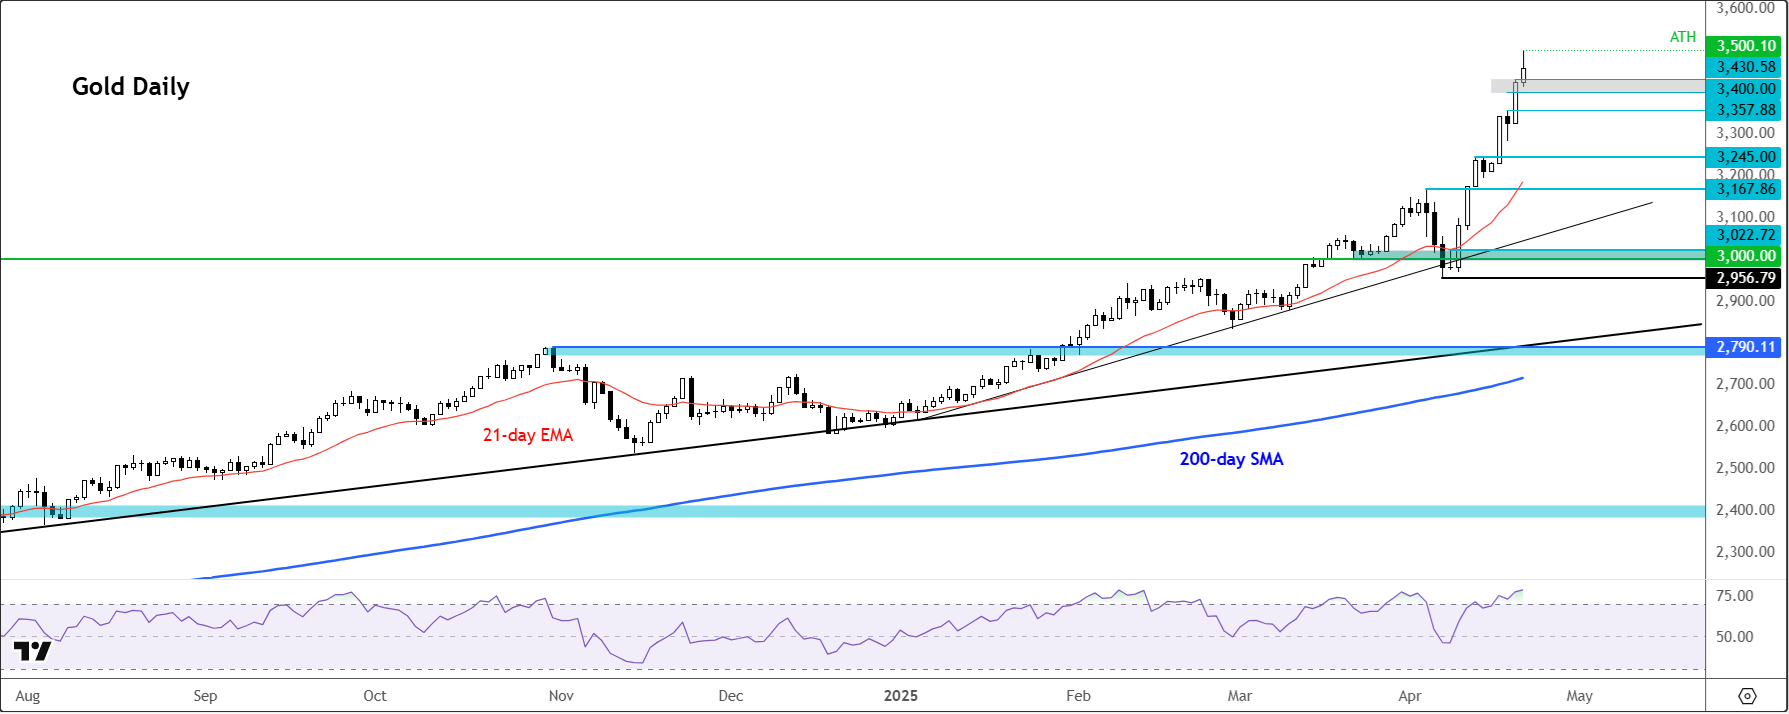
Initial supports include Monday’s high of $3,430 and the round figure at $3,400, on the daily gold chart. Further down, $3,357 marks last week’s breakout, and then comes the dependable $3,300. Should we see a more meaningful correction, $3,245 and $3,167 are on the radar—both previous resistance zones now acting as potential cushions.
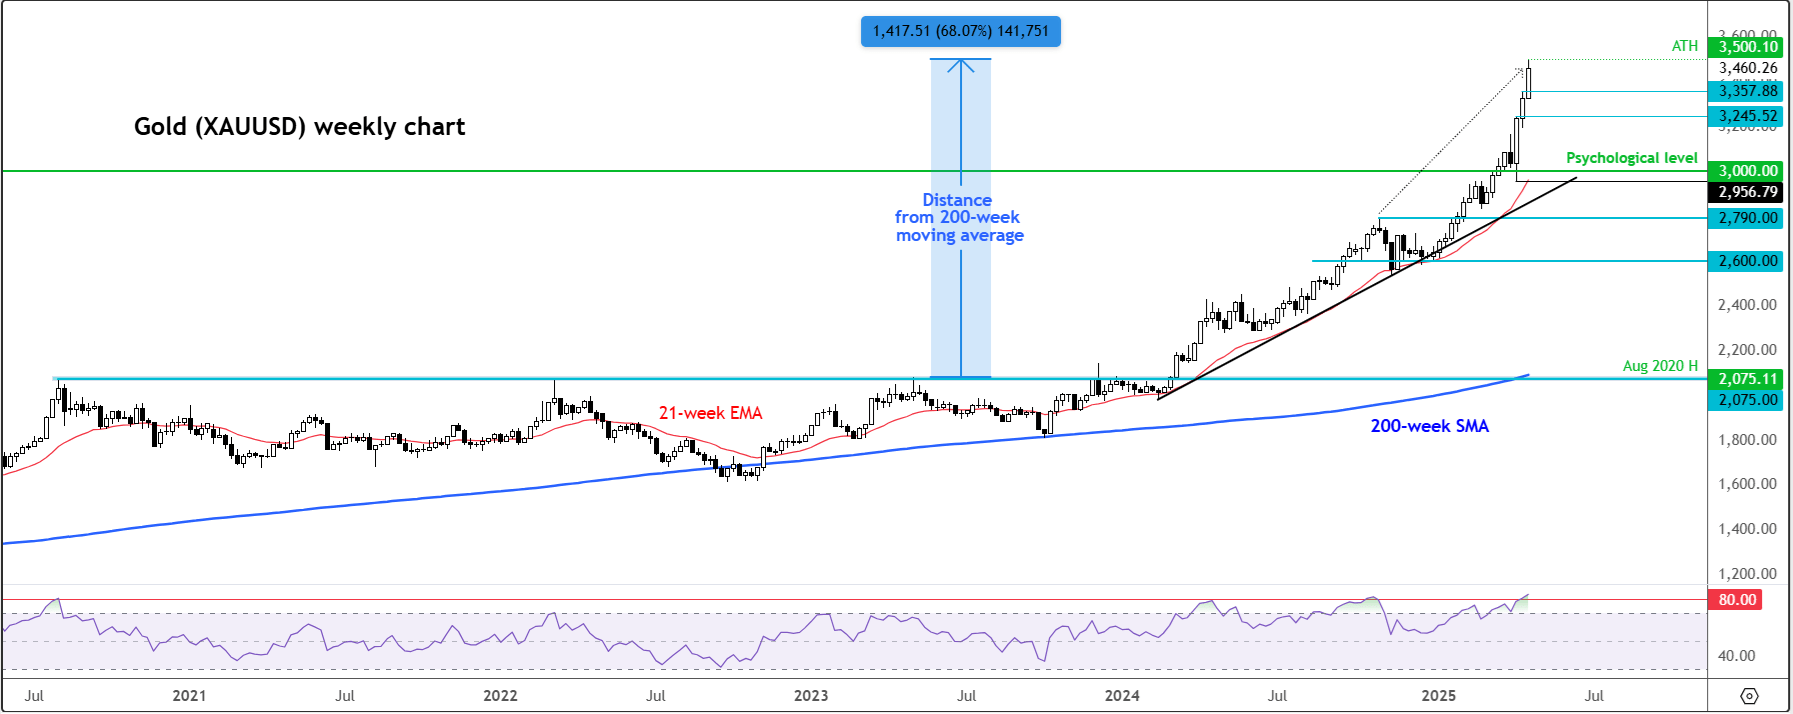
Zooming out to the weekly chart, the $3,245 and $3,357 marks still hold weight. Below that, $3,000 is the next psychological threshold, with $2,956 as the last swing low. A deeper flush could test $2,790—but that’s speculation at this point. Even then, such a dip wouldn’t necessarily signal a trend reversal. More likely, it would attract opportunistic buyers looking for another entry.
But what about the RSI?
Now here’s where things get interesting. The monthly RSI is sitting at 87, a level not seen since the fevered days of 2020 and 2011. History tells us that such extremes tend to lead to periods of sideways action or consolidation. Meanwhile, at its highest point earlier today, gold was trading an eye-watering $1,400 above its 200-week moving average—a premium of more than 67%. One has to wonder how long that kind of distance from the mean can be sustained, even in today’s macroeconomic circus.
So, how should one navigate this? Well, trend followers remain in the driver’s seat for now. But if a reversal candle crops up—particularly on the daily or weekly chart—with some follow-through, sentiment could shift rapidly. Until we see a clear pattern of lower highs and lower lows, any dip is more likely to attract bargain hunters than panic sellers.
Source for all charts used in this article: TradingView.com
-- Written by Fawad Razaqzada, Market Analyst
Follow Fawad on Twitter @Trader_F_R
Latest market news

April 25, 2025 04:18 PM

April 23, 2025 04:30 PM