

Over the past five trading sessions, gold has shown a significant bearish bias, accumulating a decline of more than 4.5%. This sustained downward movement stems from the recent easing of trade tensions, following a series of positive remarks from the White House regarding negotiations with various countries. If this favorable environment continues, selling pressure on gold may persist as investors reduce their exposure to safe-haven assets in the short term.

Is the Tariff War Easing?
Currently, the United States maintains a 145% tariff on all products imported from China, representing one of the highest points in the trade war driven by the U.S. administration this year. However, in recent days, there has been a clear shift in tone. The Treasury Secretary labeled these tariffs as unsustainable, and shortly after, President Trump stated that a reduction in tariffs on Chinese products was being considered. He also mentioned that over 200 agreements had been signed with various countries and that he maintains ongoing communication with President Xi Jinping to move the matter forward swiftly.
This shift in trade policy has been one of the main catalysts behind the recent bearish pressure in gold. As a safe-haven asset, gold tends to benefit from market uncertainty. However, the apparent de-escalation of trade conflict has reduced risk perception among investors, weakening demand for such assets and increasing selling interest in the XAU/USD pair.
Another key factor has been the recent strengthening of the U.S. dollar, fueled by optimistic comments from the Trump administration. The DXY index, which measures the dollar’s strength against a basket of major currencies, has rebounded from lows of 98.28 to levels near 100 points. This recovery, partially reversing the dollar’s year-long bearish trend, adds further headwinds to gold.
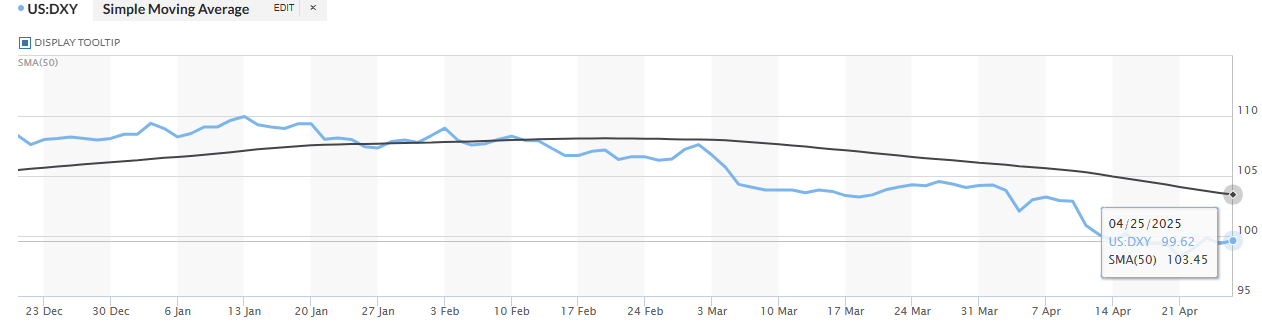
Source: Marketwatch
Since gold is priced in dollars, its appreciation makes it more expensive for international buyers, thereby reducing demand. Moreover, gold is often used as a hedge against a weakening dollar, so when the greenback strengthens, the incentive to hold gold diminishes. If the uptrend in the U.S. dollar continues, the downward pressure on XAU/USD could intensify.
Confidence Rebounds
The Fear & Greed Index, published by CNN, has shown a significant improvement, moving from “extreme fear” territory into a more moderate “fear” zone, with a current reading of 35. This shift reflects a recovery in investor confidence, which has also contributed to diminishing gold’s appeal as a safe-haven asset.
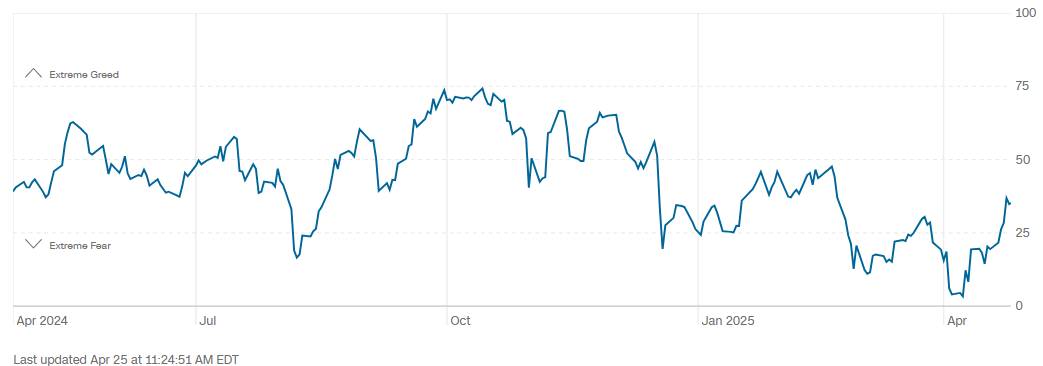
Source: CNN
This rebound in market sentiment has been a key driver in recent sessions. As long as the index remains at current levels or continues rising, it is likely that gold will face weaker demand from investors who are showing a greater appetite for risk. If this trend persists, the selling pressure on gold could grow stronger in the short term.
Technical Outlook for Gold
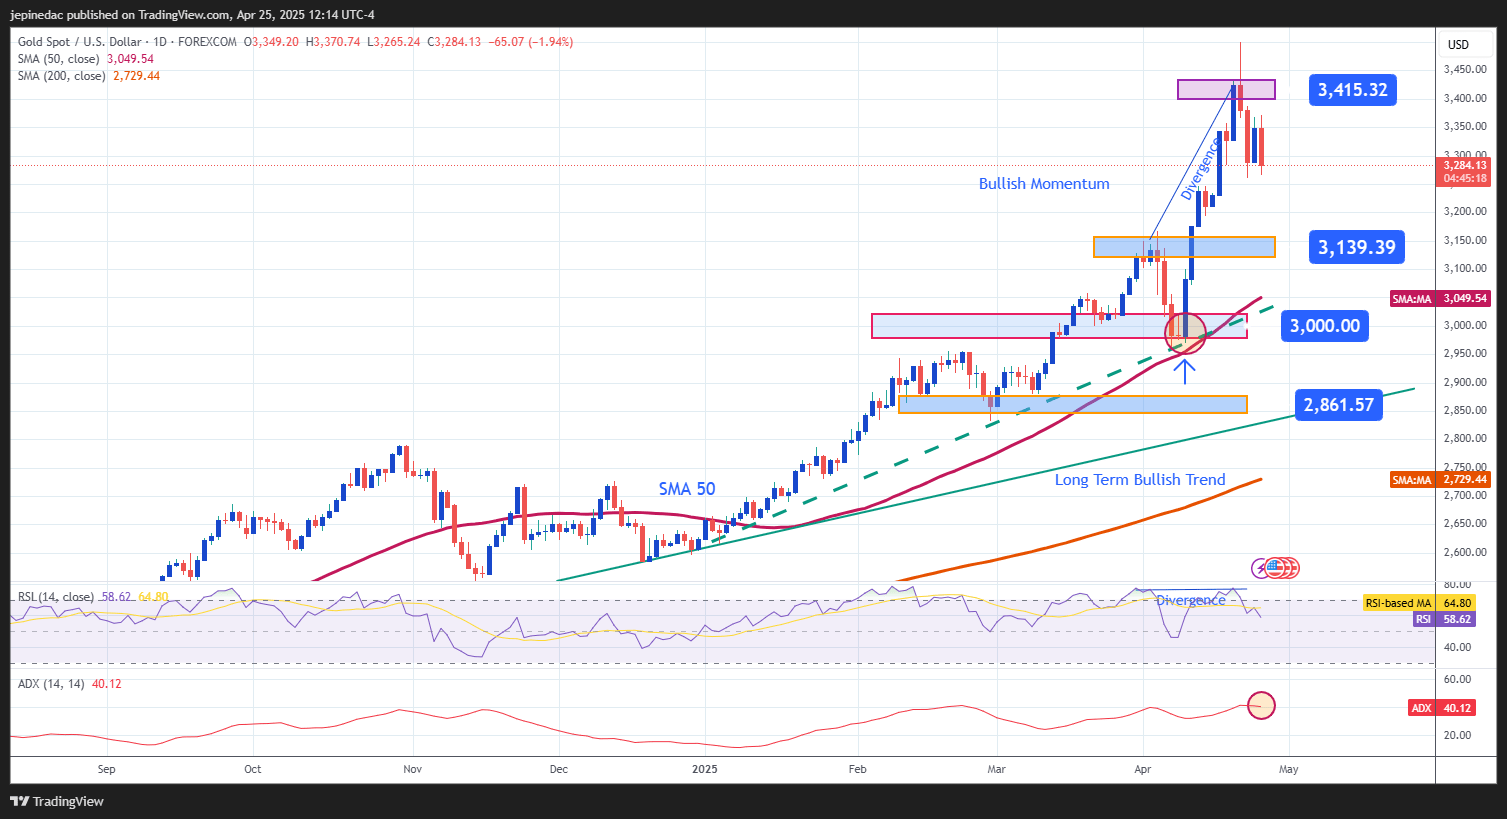
Source: StoneX, Tradingview
- Uptrend: Gold’s technical structure has remained predominantly bullish in recent months. Since early 2025, the price has followed a steeper trendline, breaking through the psychological barrier of $3,000 per ounce. Although some bearish movements have emerged recently, they have not been strong enough to breach key support levels, meaning the bullish formation remains the dominant technical pattern over the longer term.
- ADX: The ADX line continues to oscillate above the neutral level of 20, though it has begun to flatten near 40, which may indicate a decrease in volatility and directional strength. If this flattening trend continues, it could signal a phase of market consolidation in the short term.
- RSI: The RSI indicator continues to post consistent highs, while the price of gold registers new higher highs. This mismatch signals a bearish divergence, as momentum fails to keep pace with price action. This is often interpreted as a sign of waning buyer strength, increasing the risk of short-term corrections.
Key Levels to Watch:
- $3,400 – Major Resistance: This level represents recent all-time highs. A sustained move above this point could confirm a bullish bias and provide continuity to the uptrend.
- $3,140 – Relevant Support: This is a technical zone that may act as a potential barrier against short-term downside corrections.
- $3,000 – Critical Support: A key psychological level that aligns with the 50-period simple moving average. A breakdown below this threshold could put the bullish formation at risk.
Written by: Julian Pineda, CFA – Market Analyst
Follow him at: @julianpineda25
Latest market news

April 23, 2025 09:57 AM

April 23, 2025 08:29 AM

April 21, 2025 08:55 AM