

Gold Talking Points:
- Gold prices have been pushing aggressively higher, and this week has already seen the metal break above the $3100 level on the way to current resistance at $3125.
- There’s a lot of different reasons contributing to the move and a big one appears to be global uncertainty around Tariffs as President Trump’s ‘Liberation Day’ fast approaches.
- As I’ve been saying on Gold, I still see little reason for a bearish stance. The challenge at this point is working with a trend that’s overbought from a variety of standpoints, and I look into that below.

Gold prices are back to overbought via RSI on the monthly, weekly, daily, four hour, hourly and even 30-minute charts. On the monthly, gold is even more overbought now than it was back in September, when the metal topped for a few months. The bigger question at this point is whether that overbought backdrop matters as there’s obviously a reason, or a few reasons, that this has all taken place.
Trends are always going to be unpredictable. One that’s been this consistent can often be alluring in the fact that it seems perhaps more predictable than normal. But, traders need to remain cautious as the prospect of ‘buying a top’ is very much a realistic possibility, and we can see that trepidation playing out in many cases when prices stall ahead of a first test of a major psychological level.
We saw this in February with the $3k level. As prices got about $50 away from that first test of $3k, buyers shied away multiple times, eventually allowing for a pullback down to $2832 that held through the March open. The next push up towards $3k sliced through, and bulls continued to push until, again, a bit of pause appeared at the $3,050 level.
That led to a pullback that lasted through last week’s open but this time, that $3k level was looking attractive to buyers and bulls held support there on the pullback, then launching prices up to another fresh all-time-high to go along with this morning’s first break of the $3100 level on the way up to $3125.
Gold Four-Hour Chart
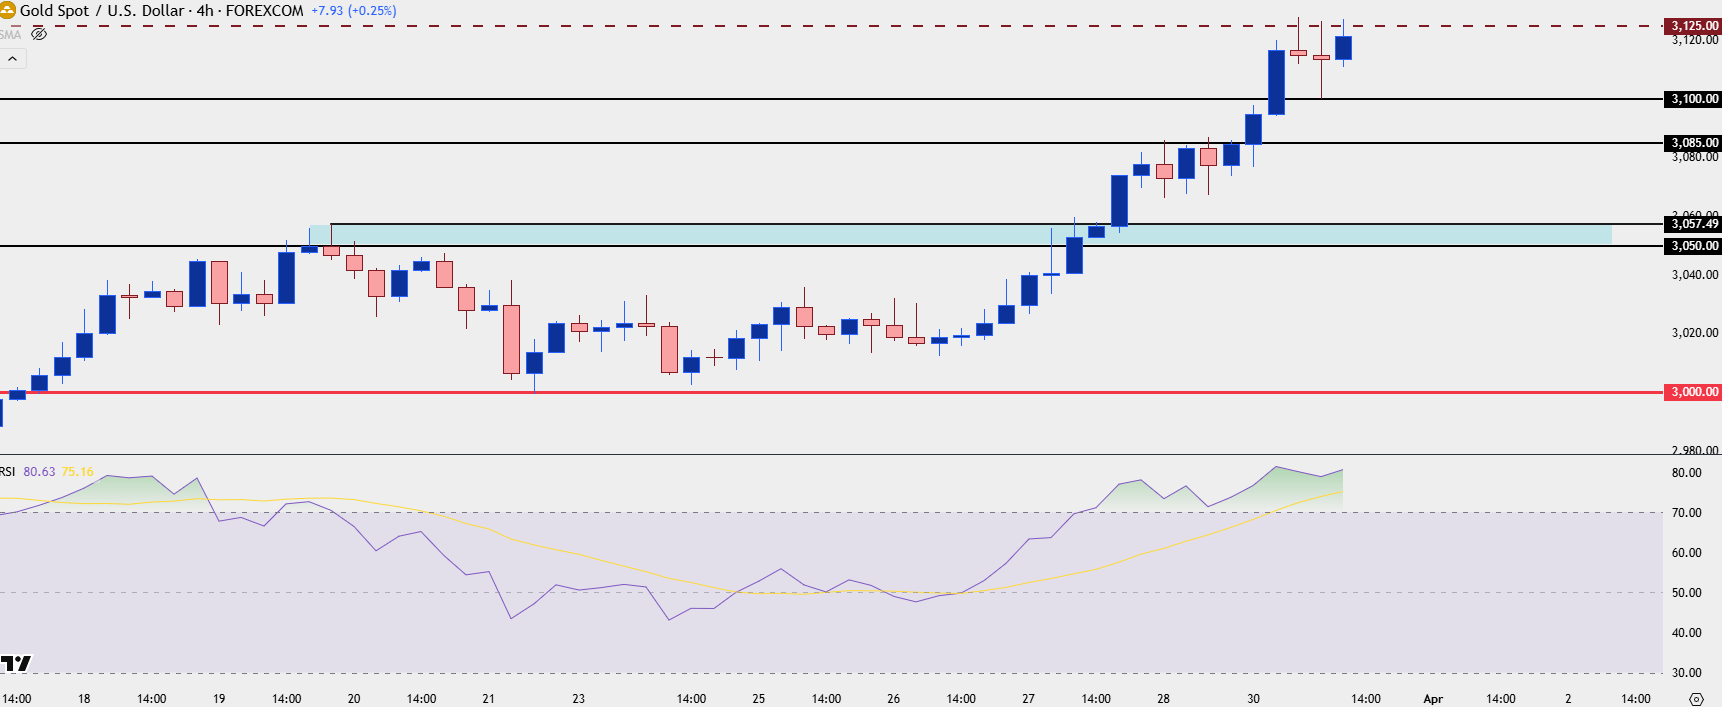
Chart prepared by James Stanley; data derived from Tradingview
Gold: The Reasons
Headlines loves to attribute reasons for a move and oftentimes that works best when there’s one obvious culprit that can be pointed to. For gold, that can be anything from a war bid to a USD-weakness scenario. Or perhaps it’s anticipation of a dovish FOMC even as inflation remains high, such as we saw last February and appeared to be the driver that kicked off the bullish breakout in gold and the initial trend over the $2k level.
But, sometimes, those reasons aren’t as clear – and others, there’s multiple reasons with some obvious ones and others that aren’t so obvious.
At this point I think we can easily say that some of the obvious are driven by uncertainty around tariffs, and with news of possible 20% across-the-board tariffs coming on Trump’s Liberation Day this Wednesday, that makes sense. But perhaps the bigger question is whether there’s a less obvious reason that’s contributing to the push, such as a Central Bank acquiring gold or something of that nature.
While it would be simple to wrap this entire move up into a box and add a bow saying it’s all driven by ‘uncertainty,’ that wouldn’t quite explain why the push has been so incredibly consistent; why massive short-term trends have developed despite widely-stretched longer-term moves.
For this reason, I would still hesitate to get too bearish on gold especially with a near-parabolic like trend in-force. This could, however, point to support potential at some of those same spots of prior stall or resistance.
The $3100 level has already come in as support this morning but that could remain as a spot of support potential if we do see a pullback. Below that, $3085 would remain of interest as this showed a slowing in the trend last week; but it’s the $3050 area that provided the last workable pullback, and that zone up to $3054 hasn’t yet been tested for support since the breakout.
Gold Hourly Price Chart
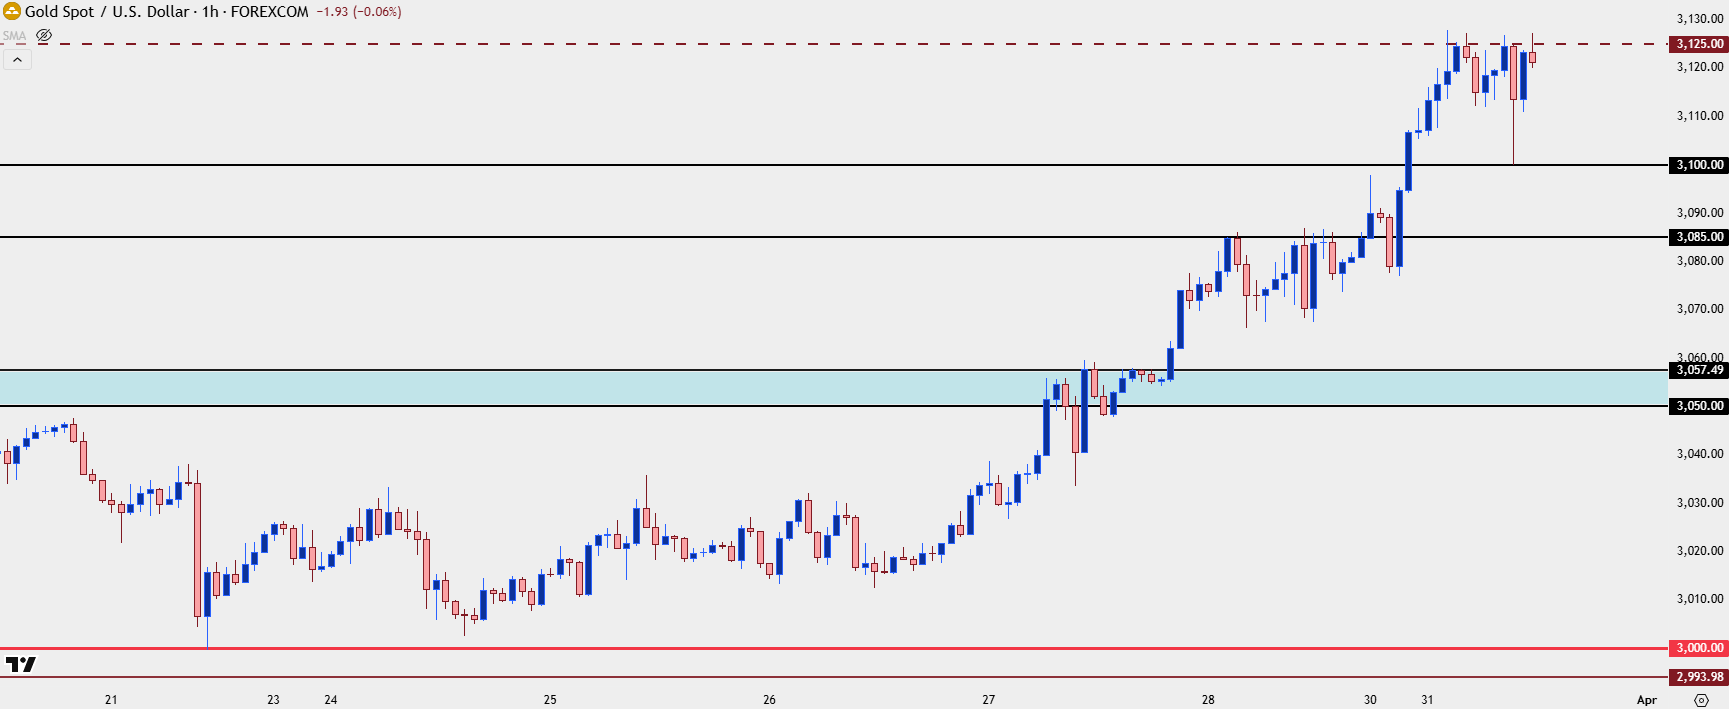 Chart prepared by James Stanley; data derived from Tradingview
--- written by James Stanley, Senior Strategist
Latest market news

April 8, 2025 02:20 AM

March 31, 2025 04:11 PM

March 28, 2025 05:29 PM

March 21, 2025 06:59 PM