

S&P 500, USD, EUR/USD, Gold Talking Points:
- The Federal Reserve rate decision as well-received by the risk-on crowd today, with SPX breaking out to a fresh near-term high.
- Gold also touched a fresh high as spot Gold hit the $3,050 level for the first time ever.
- Currencies showed more of a mixed reaction as the USD gave back early-session gains and EUR/USD bounced from a big support level at 1.0865. The daily chart of EUR/USD is of interest, as outlined earlier in the session ahead of the FOMC announcement.

It was a big rate decision for Jerome Powell and he seemed quite careful with his speech and responses to the media’s questions. The item that I think stuck out the most was bringing back the ‘transitory’ phrasing and that certainly seemed to be warmly revieved by equity bulls as it helped the S&P 500 to mount a breakout up to the 5700 level.
As I’ve looked at a couple of times already this week, in the Monday article and the Tuesday webinar, the S&P 500 was at an interesting spot following the rally late last week, helping to leave an elongated wick on the underside of the weekly chart. I took a longer-term look at the matter in this week’s equity forecast and, so far this week, bulls have remained in order.
Bulls continued to press around today’s rate decision and that’s helped buyers to venture into the gap leftover from last week’s open. At this point, the S&P 500 has fallen for four consecutive weeks but if we do see a green candle this week, especially if that takes out the 5702/5705 area, this could take on a bullish look from longer-term charts.
S&P 500 Weekly Price Chart
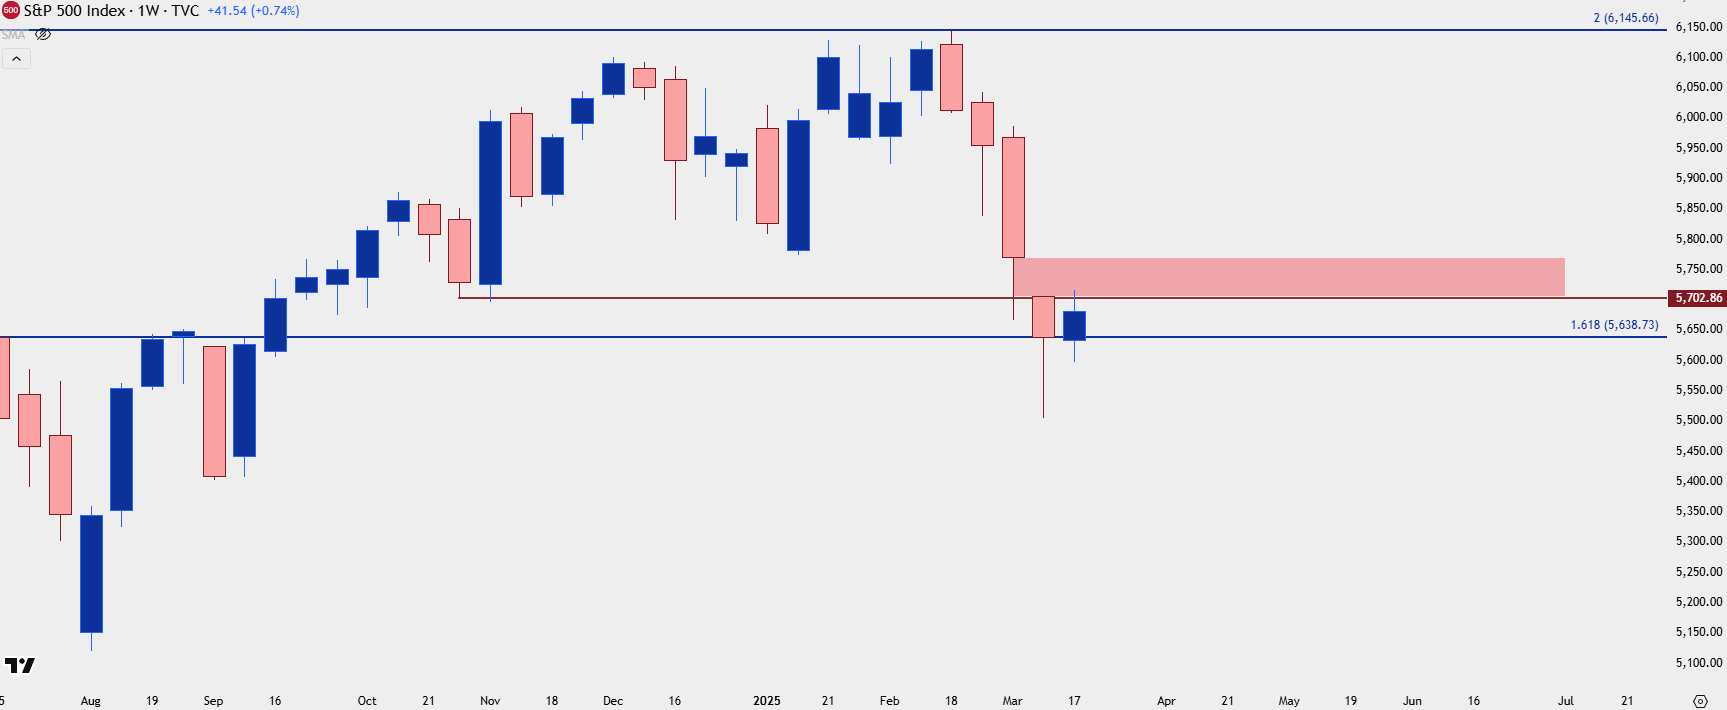 Chart prepared by James Stanley; data derived from Tradingview
S&P 500 Shorter-Term
On a near-term basis the question now is whether bulls can sustain the move by holding support at higher-lows. As of this writing, there’s been a hold of support above the gap from yesterday morning, around the 5676 level which spans down to 5669 to create a zone of interest. Below that, the 5638 level remains important and that helped to set a higher-low ahead of the FOMC breakout.
If bears can push through 5600, that will look like a strong rebuttal of the FOMC move, and would then expose some unfilled gap running from 5521-5566.
S&P 500 Hourly Chart
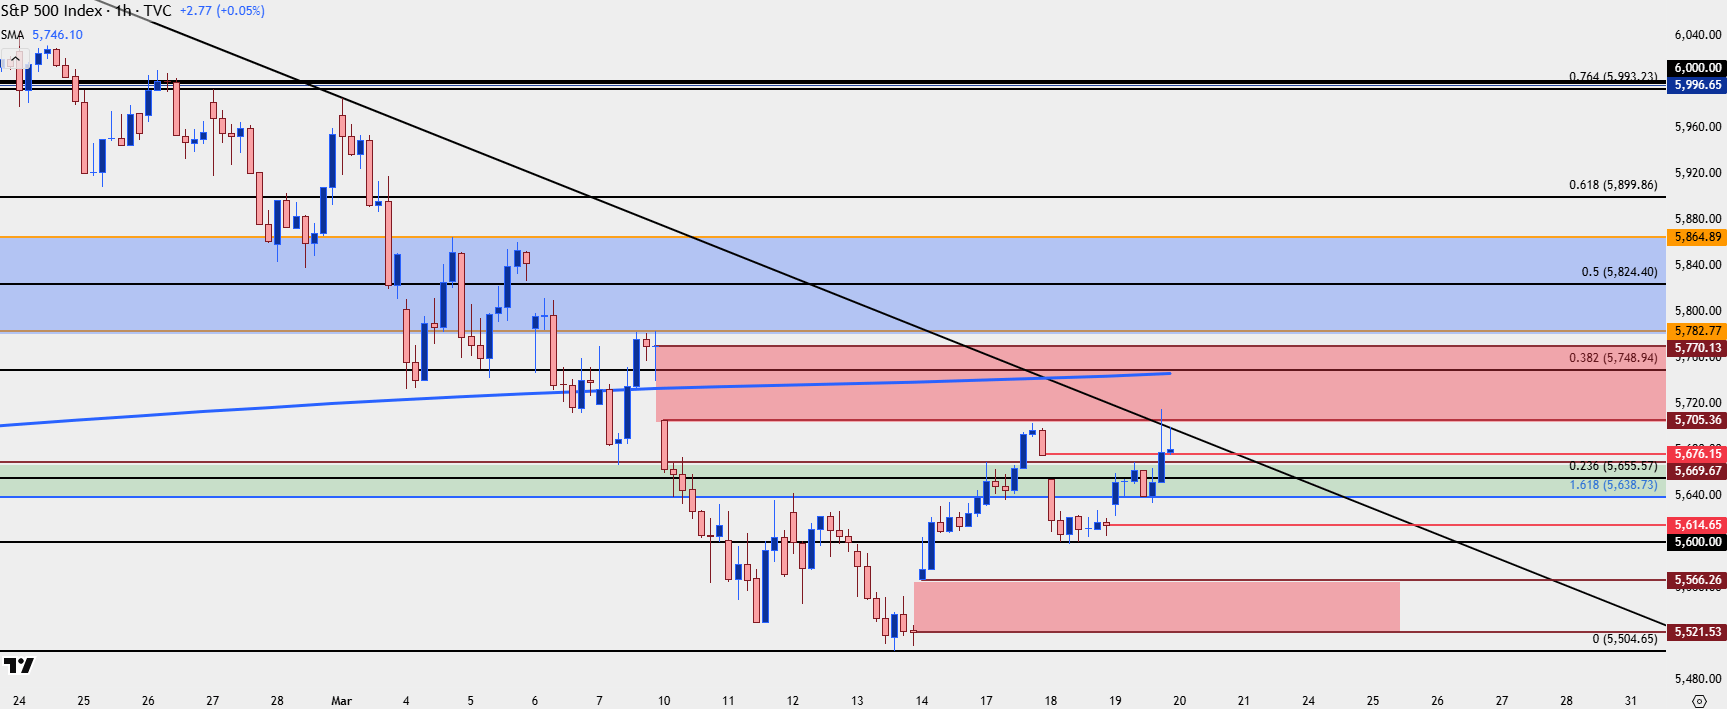 Chart prepared by James Stanley; data derived from Tradingview
Gold
Gold has looked even less uncertain as the metal pushed its first ever test of the $3,050 level. But, perhaps more interesting to traders than that was the support that built-in ahead of the meeting announcement, with the $3,030 level holding multiple support inflections as shown from the four-hour chart below.
So, bulls are still showing control and as I said in yesterday’s webinar, I’d hesitate to try to muster a bearish case here. But that said, I’d also be cautious of chasing these especially given price is testing that $3,050 level for the first time ever. There could be a case for higher-low support at or around $3,045 which was a prior high, as well as $3,040; but if the metal falls below $3,030 with a closed body on the four-hour or daily chart, it’ll start to look more primed for pullback potential. The $3k level could be of particular interest for that theme a there hasn’t yet been much for support at the big figure.
Gold Four-Hour Chart
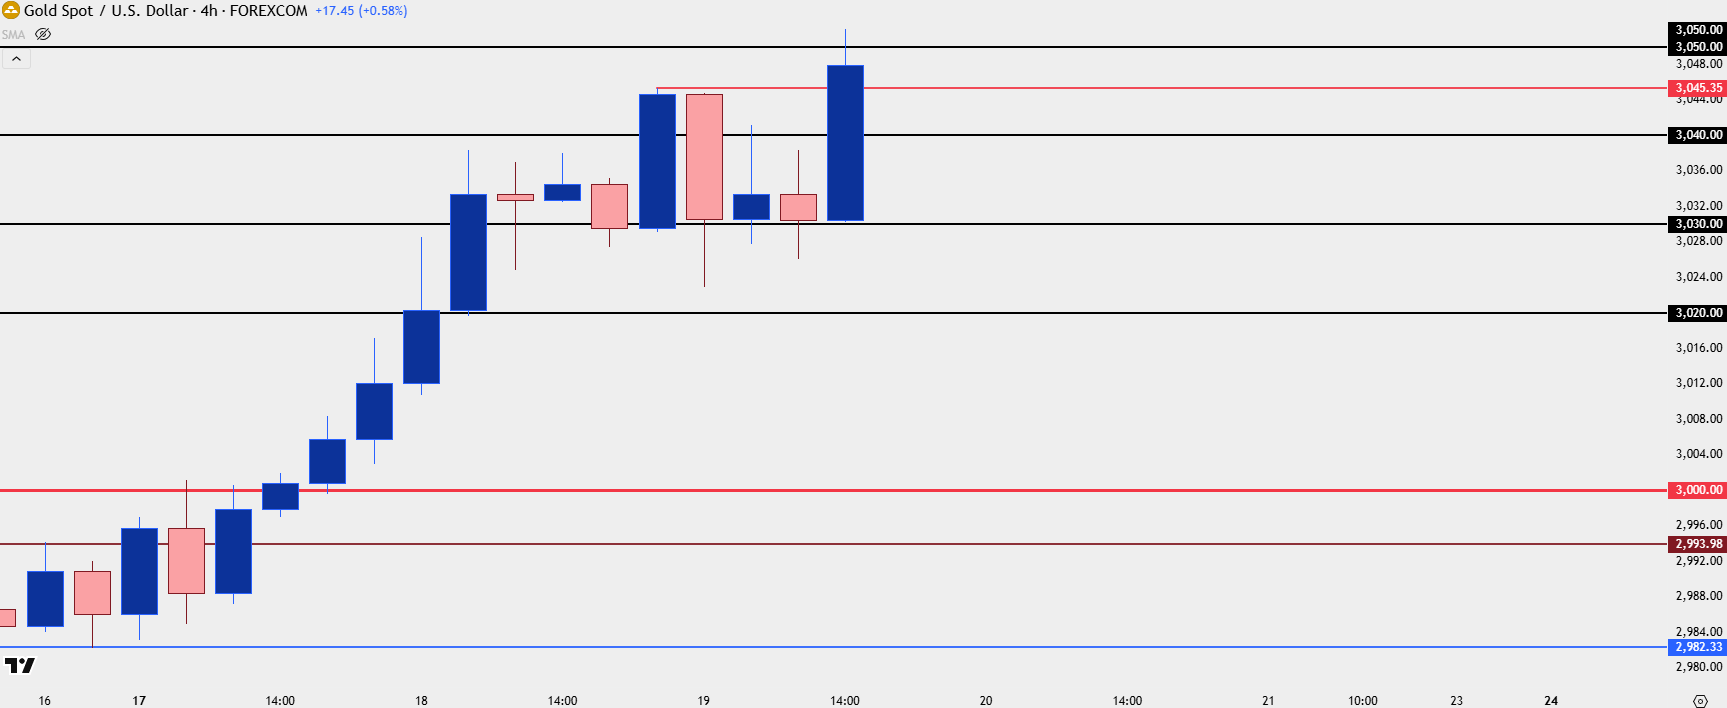 Chart prepared by James Stanley; data derived from Tradingview
USD
There’s little excitement in the US Dollar at the moment as the currency essentially gave back early-session gains. The capitulation scenario didn’t show up as there was no press to fresh swing-low, although the divergence theme is still in order as yesterday’s fresh low in price was accompanied by a higher-low via RSI. I had spoken of this in the webinar yesterday and this can start to build evidence for a possible turn in the USD, although bulls have yet to take a substantial step forward at this point.
US Dollar Daily Price Chart
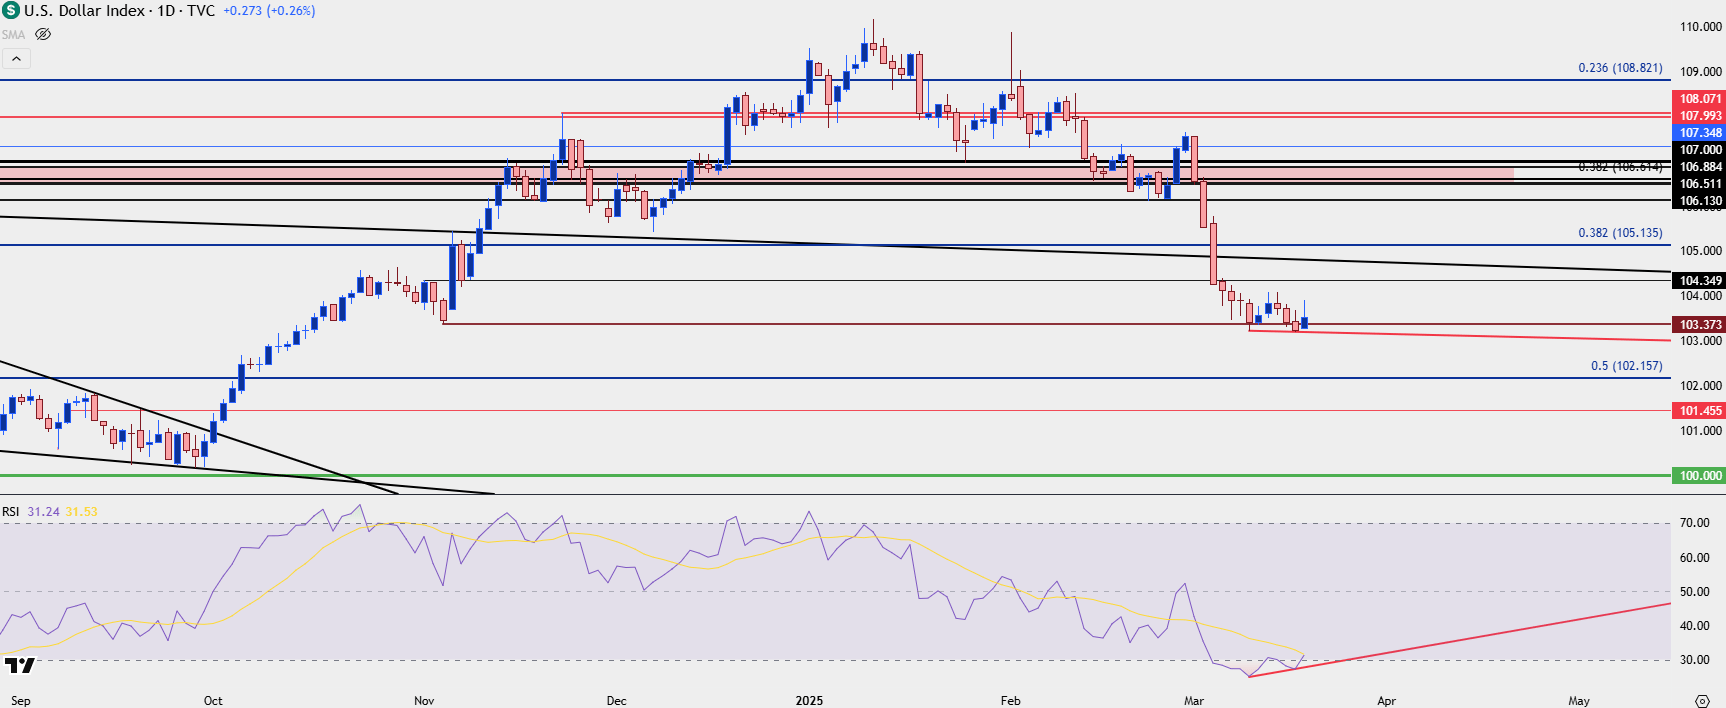 Chart prepared by James Stanley; data derived from Tradingview
EUR/USD
I wrote about EUR/USD earlier in the day and a few different items remain of interest there.
The Fibonacci level at 1.0865 helped to hold the session low, coming in right around the FOMC announcement. That keeps an ascending triangle formation in order, which is often tracked for bullish continuation. So much like we can’t rule bears out in the USD, we can’t rule bulls out in EUR/USD as of yet.
But there could be growing tendency for a turn, as RSI divergence has shown here, as well, and bulls are already looking beleaguered after a massive move earlier in the month. If they can stage a breakout, the 1.1000 level looms large overhead, and that could be of interest for a pullback, and possibly more if it does come into play.
EUR/USD Daily Price Chart
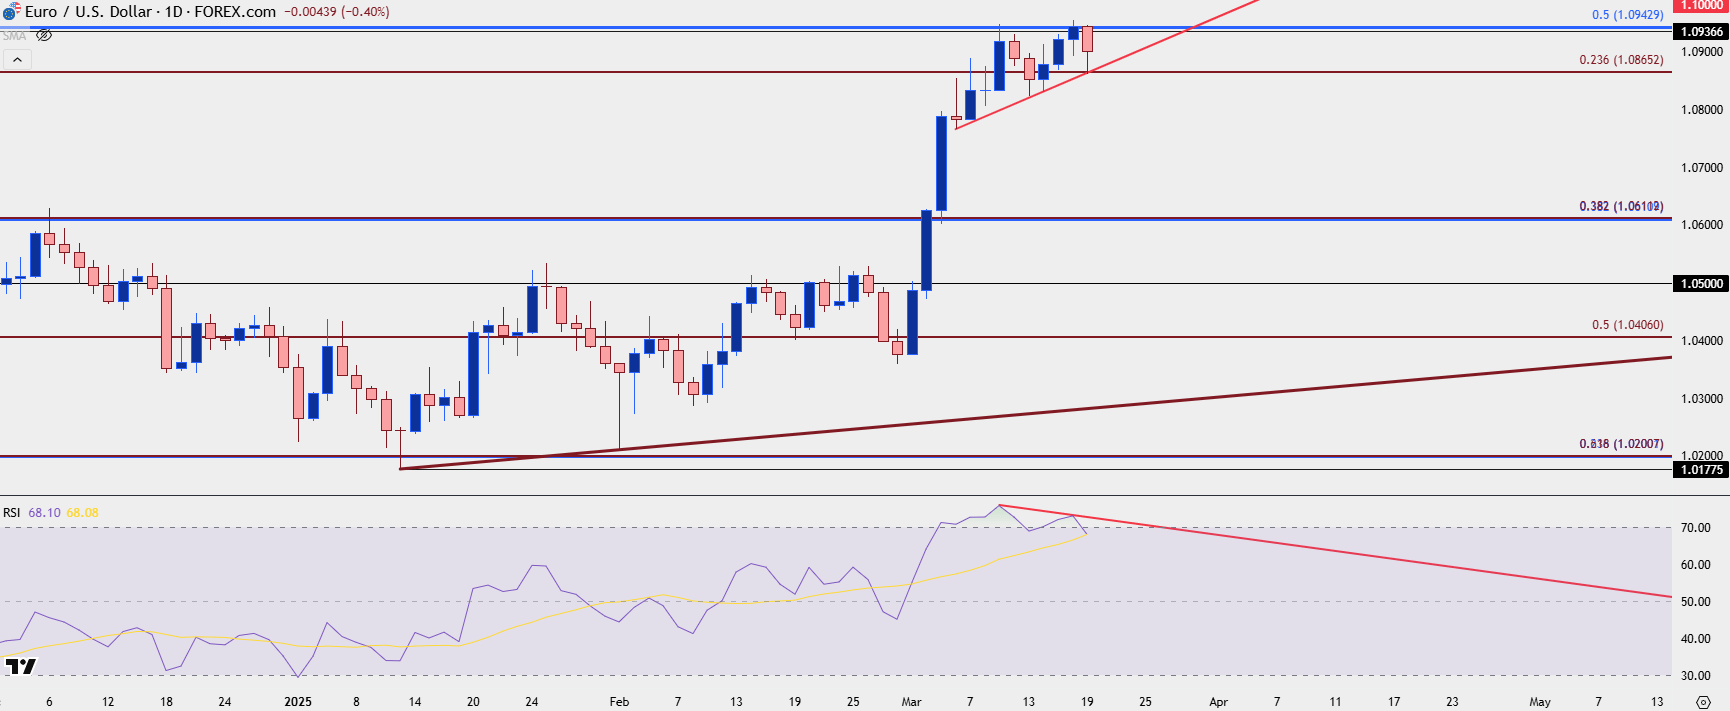 Chart prepared by James Stanley; data derived from Tradingview
--- written by James Stanley, Senior Strategist
Latest market news

March 19, 2025 10:01 PM

March 19, 2025 03:54 PM

March 19, 2025 12:34 PM

March 19, 2025 12:30 PM