

Gold Talking Points:
- Gold prices have continued to find buyers at higher-lows, even with the continued hold of resistance below the $3500/oz level that came into play in April.
- The rally in gold ran for more than 75% from last year’s low to this year’s high, and the metal has been in an overbought state for much of the time from a variety of different indicators. The bigger question is whether that matters?
- Perhaps more interesting is the reason compelling buyers to continue accumulating even at these overbought levels, which traditionally would deter fresh longs.
A 75% rally in fourteen months is a massive move for almost any market, but for gold, where macro-economic drivers tend to reflect in price, that jump illustrates more than just a peak-to-trough gain of $1500/oz.
Gold has a way of trying to look around the next corner. As a case in point, gold prices began to rally from a low in November of 2008 as the Fed was gearing up to change the way that they communicated with markets. The Financial Collapse was a jarring event, and while the Fed had previously enjoyed a degree of discretion, the worry created by the sell-off pushed the Fed into a dovish state that hadn’t really ever been seen.
Low interest rates were there as the bank tried to stimulate the economy, but soon to come were multiple rounds of Quantitative Easing, the dot plot matrix and an over-active set of FOMC members happy to opine to the press about their feelings of just how dovish they remained to be. The logic there was clear, if the Fed could communicate that they had little interest in raising rates anytime soon, market participants would be incentivized to take on risk. Market rates could stay low and riskier asset classes, like tech stocks or even just equities in general could enjoy greater capital flows.
This was to the benefit of gold as QE was essentially a manner of dilution to fiat currencies. Gold rallied aggressively from that November 2008 low until finally peaking $80 below the $2k level three years later. The rally ran for a trough-to-peak tally of 181.8%, and it was September of 2011 when prices began to stall and eventually pullback.
At the time the Fed wasn’t talking up rate hikes, they were still in the full throes of QE. But gold markets were looking around the next corner and speculating that interest rate hikes would come at some point down-the-road.
The first FOMC rate hike after the GFC happened in December of 2015, interestingly right around the time that gold prices bottomed for the decade at $1,046/oz. The Fed was really careful around that move and, again, gold started to look around the next corner, rallying into the summer of 2016 before pulling back around the 2016 election, after which the Fed hiked again in December. But that’s when gold held a higher-low and then started to move-higher again.
Gold Monthly Price Chart
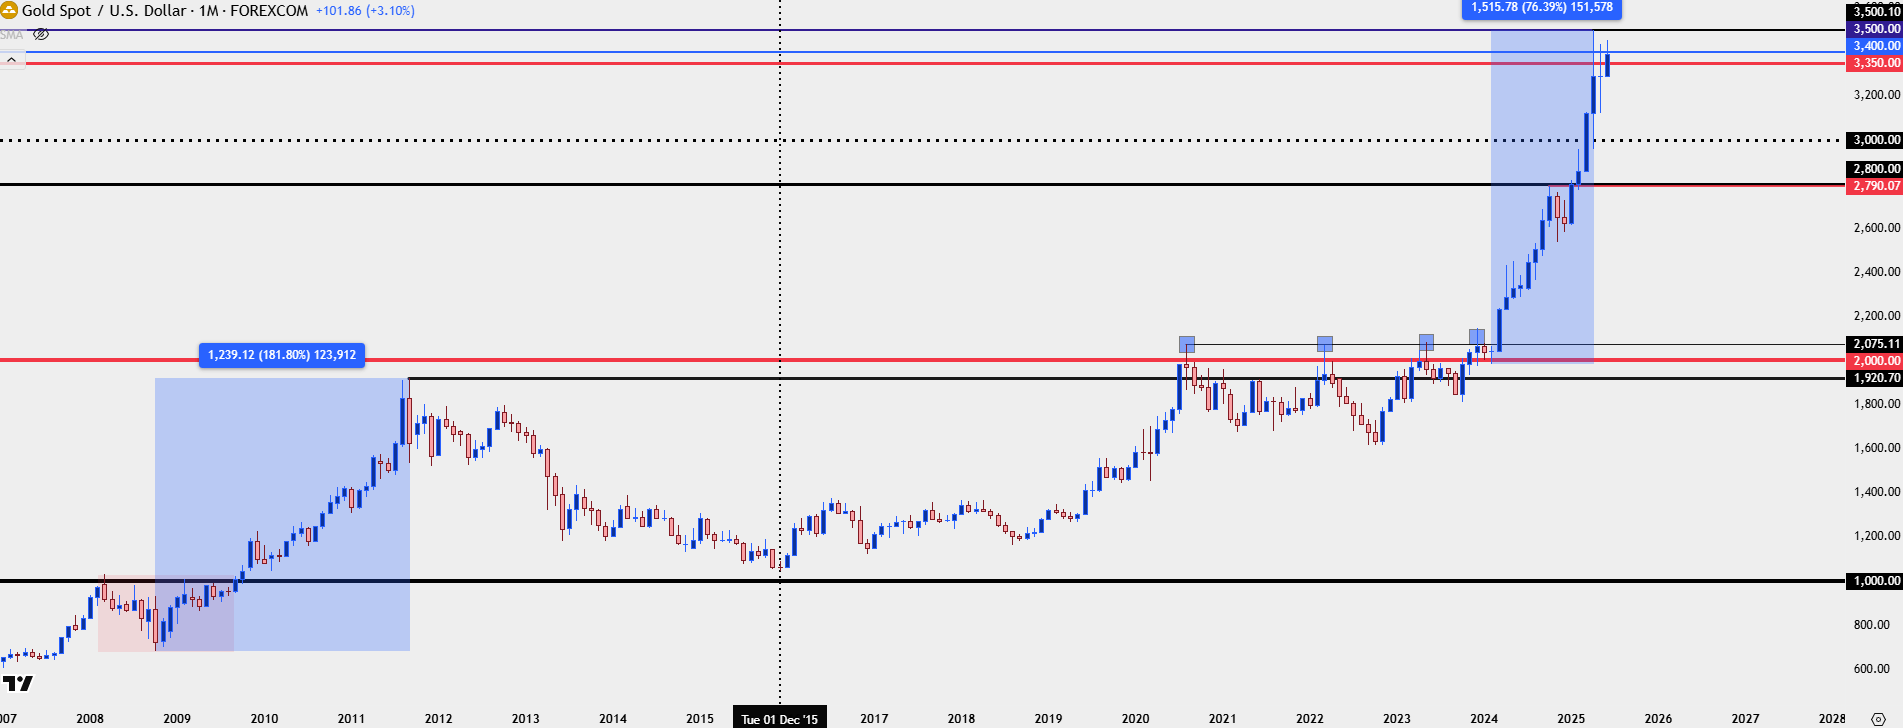 Chart prepared by James Stanley; data derived from Tradingview
Gold $2k
Gold stalled before testing $2k during the 2011 run but the shockwaves of Covid, and perhaps more accurately, the Fed’s response to Covid, were enough to finally elicit a test of the big figure.
After holding $1700/oz as resistance in early-2020, a pullback around the pandemic getting priced-in was met with intense buying demand, and gold finally pushed up to $2k/oz in August of 2020. The Fed was full ‘pedal-to-the-floor’ with policy at the time, something that would normally be construed as a bullish factor for gold. But, just like we saw back in 2011, more important than what was happening at the time was what was expected to happen after, and that was the premise of higher rates of inflation on the back of all that stimulus that, eventually, could force the Fed to hike rates and tighten policy.
Gold then ranged for three and a half years, through both dovish Fed backdrops and hawkish Fed backdrops as the bank was finally forced to hike in 2022. That range held all the way until February of last year, when markets started to, again, try to look around the next corner.
Gold Weekly Chart
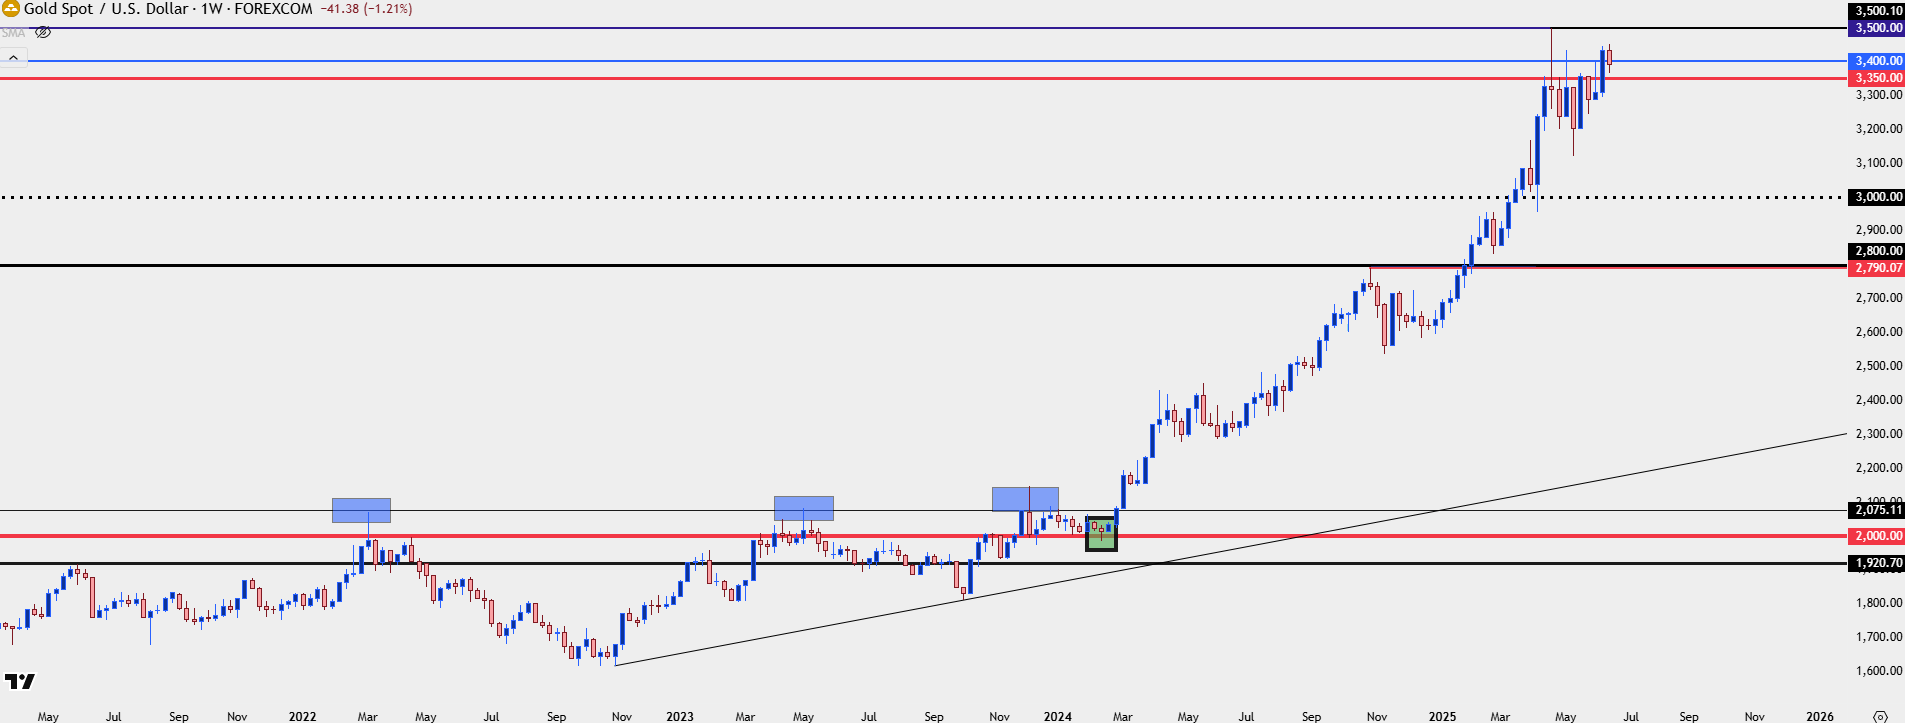 Chart prepared by James Stanley; data derived from Tradingview
Gold Parabolic Breakout
Last February was an important outlay…
At the time inflation remained stubbornly high. The Fed slowing and then ending rate cuts had accompanied a stall in CPI, as inflation refused to budge lower as the Federal Reserve was using the dot plot matrix to highlight their desire to start cutting rates.
In February, another above-expected CPI print was released, with headline CPI increasing from the prior month and Core CPI printing at 3.9% again, almost double the Fed’s 2% target.
This created a quick shockwave of concern as the USD rallied and gold prices dipped below $2k/oz for the first time in 2024 trade.
But the more over-arching aspect of that episode wasn’t the inflation print, but the Fed response to it. In a television interview a day later Chicago Fed President Austan Goolsbee implored with markets: ‘let’s not get too flipped out over one inflation print.’
The thing is it wasn’t just one print, it was the pattern, and the fact that inflation had not pushed lower as the Fed had forecasted it would. This brought to question that dot plot matrix highlighting eventual cuts from the FOMC. But, a prominent Fed member seemingly discounting the data that did not go the way they expected highlighted a FOMC that really seemed to want to cut, even with inflation remaining high.
Gold then started to rally – and it didn’t really stop for the next eight months, finally leaving $2k behind on its way up to the $2800 area just ahead of the U.S. election.
Gold Daily Chart
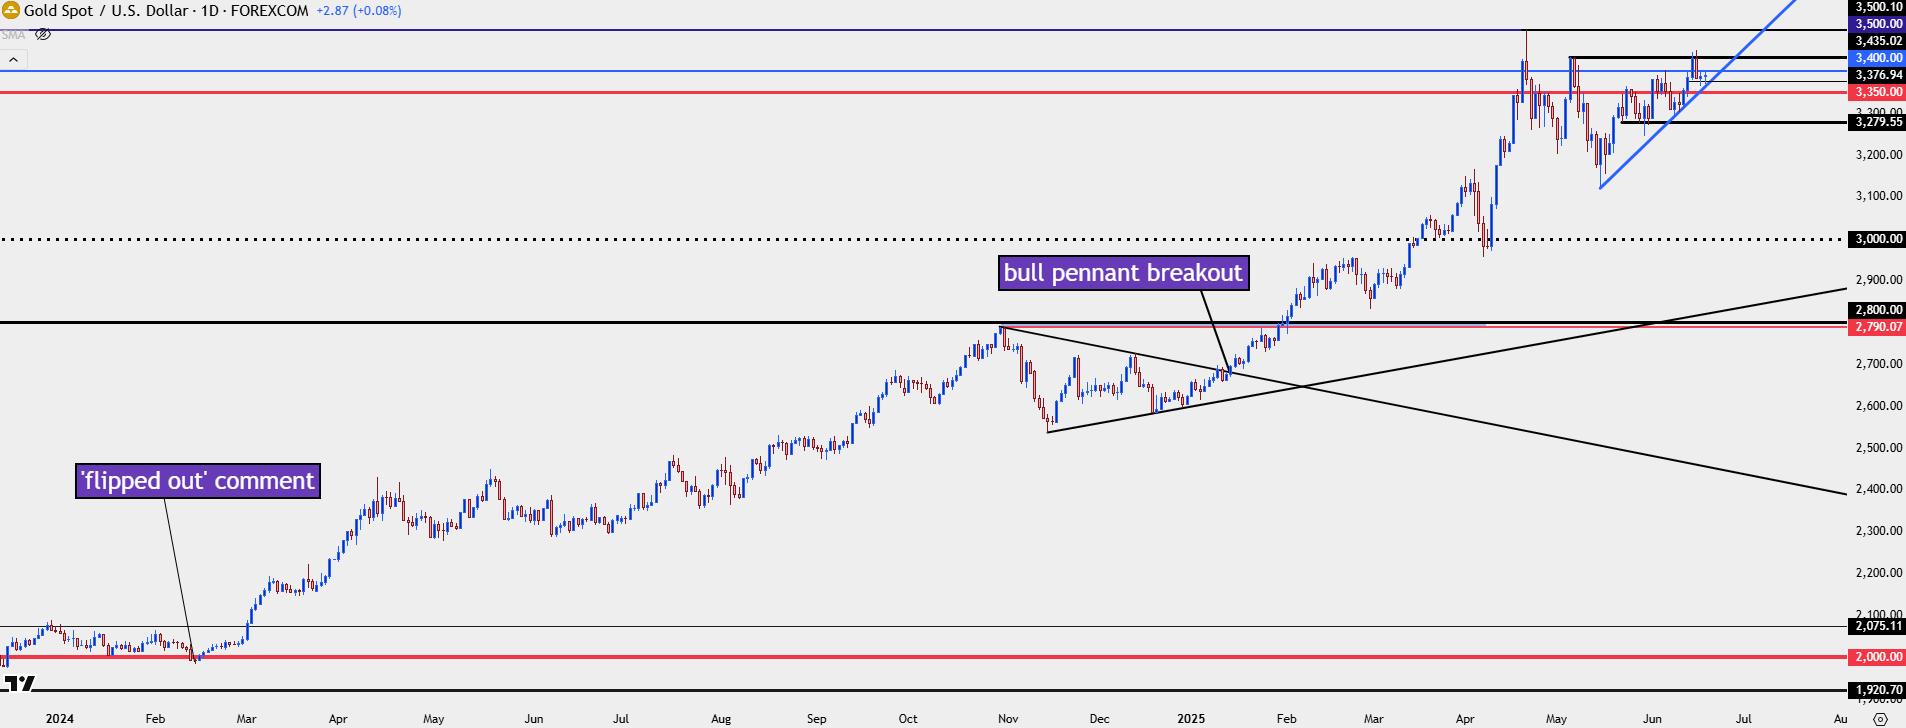 Chart prepared by James Stanley; data derived from Tradingview
Gold into FOMC
As noted at the beginning of this article gold prices are overbought from multiple vantage points. On the monthly chart, RSI is over the 85-level, which is a somewhat rare occurrence and the last time this happened was back in 2008 – just a month before gold first traded at $1,000/oz before pulling back into the Financial Collapse.
There was another close call with gold at 85 RSI on the monthly and that’s back in July of 2020 – just before gold pushed over the $2k/oz level before ranging for the next three-and-a-half years.
Just because the prior two instances noted above ended with retracement or pullback, it doesn’t mean that this one has to. But – it does highlight that chasing the move, particularly at fresh highs, could be a challenging way of going about adding long exposure to gold and I think that’s at least partly the reason why the $3500/oz level has held as resistance since April when it came into play.
Gold Monthly Chart
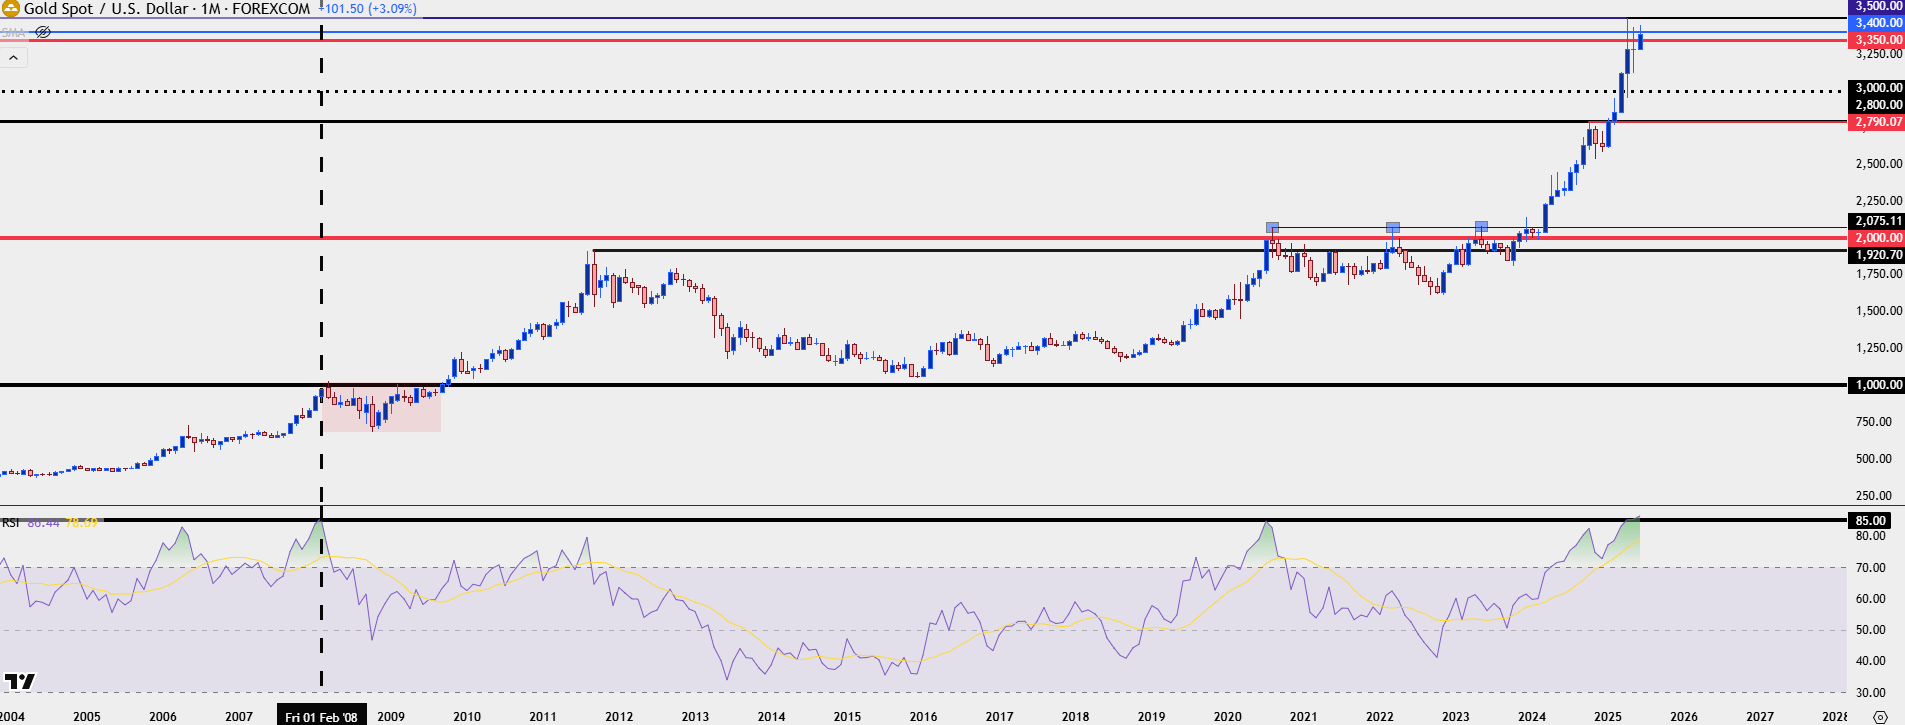
Chart prepared by James Stanley; data derived from Tradingview
But – there’s a reason that we’ve seen such an aggressive push, and just like episodes in 2008 leading into the collapse or 2020 in response to the pandemic, it’s an over-active Fed pushing dovish monetary policy and, in essence, dilutionary dynamics for fiat currencies that have pushed more capital flow into the long side of gold.
And while the Fed continues to vacillate around rate cut potential for this year, they’re also not talking up rate hikes even though inflation remains elevated from a variety of vantage points. The big question for today is whether the Fed starts to lay the groundwork for the 50 bps of cuts that markets are pricing in for 2025, the 50 bps of cuts the FOMC said they were looking for at the March meeting.
If they do, bulls could get that next shot-in-the-arm to make a run at $3500. If they don’t, we could see some longs cutting as the timeline on FOMC cuts gets pushed further out into the future.
But for traders looking at adding long exposure, that’s where the proverbial rubber meets the road as that presents an opportunity for support to show, like the episode in mid-May that I looked at during a live webinar.
There does remain bullish context here, despite buyers continued lack of testing at $3500/oz. There’s an ascending triangle formation showing on the below daily chart, and that keeps the door open for another push up to the big figure.
For support structure, there’s a few levels of interest given the bigger picture and which come into play would depend on how aggressively the Fed dashes rate cut hopes for this year – if they do at all. Last year’s swing-high at $2790 remains untested as support, so in a large sell-off scenario which I would anticipate would be a multi-month type of event, that’s a big line-in the sand.
Earlier this year, we saw a brief test below the $3k level, with prior resistance of $2950 coming in to set the lows in April; this would highlighting the $3k level as an area of support which would, technically, set the door for a higher-low. Above that, the same $3150-$3167 area would remain a viable option as this set a swing in May.
On a shorter-term basis, there’s $3325 and $3250 that remain of interest.
As I’ve been saying on webinars, a move of this nature with this length of development is incredibly difficult to chase. But to this point, bulls have not shied away from supporting higher-lows and until that happens, I remain biased on the bullish side of gold.
Gold Daily Chart
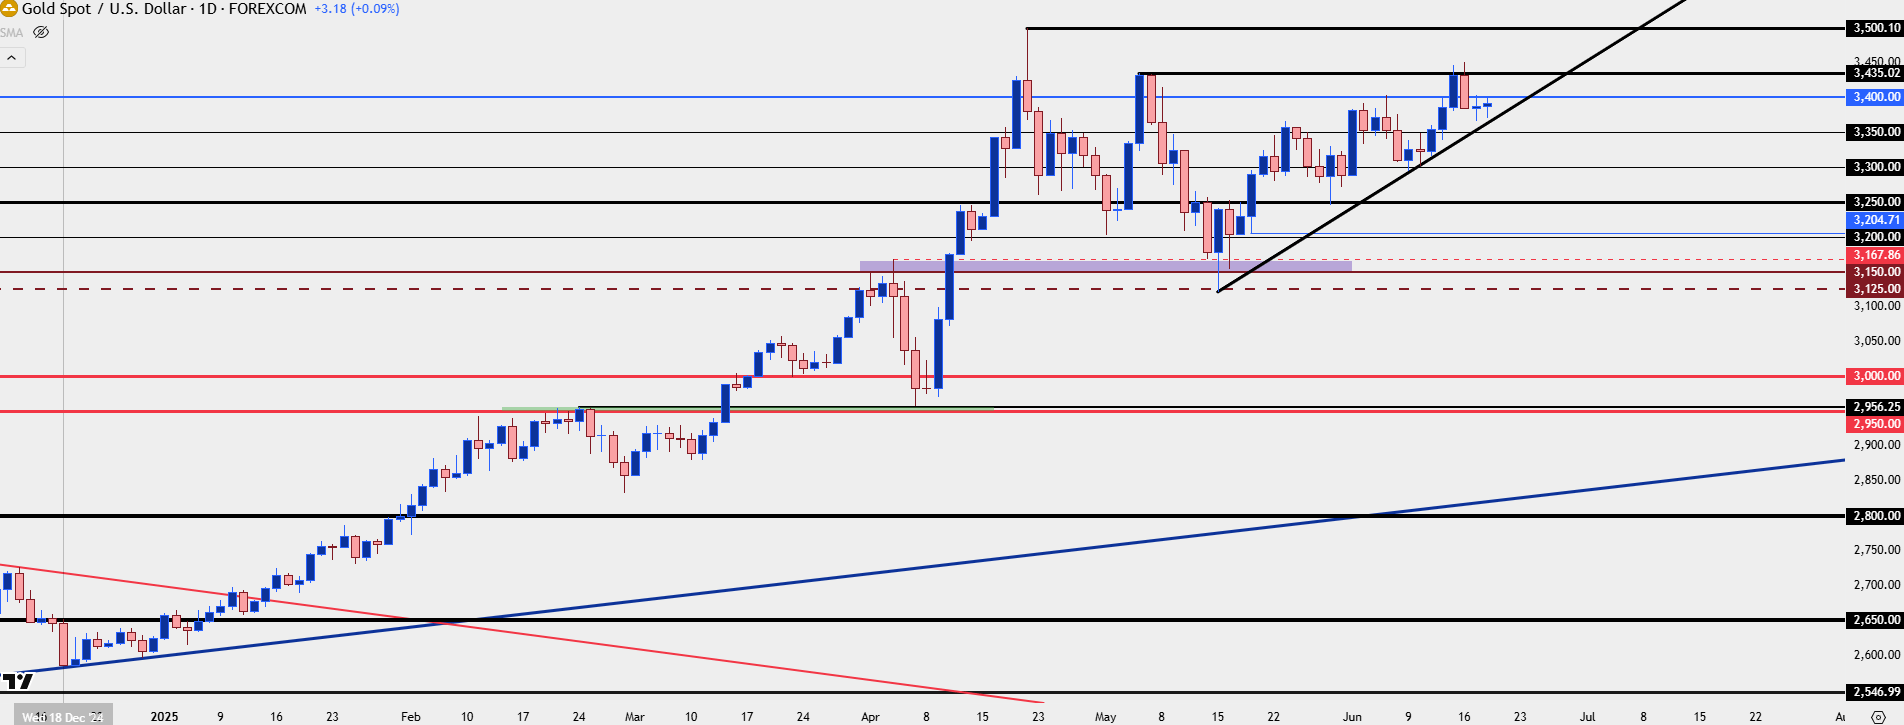
Chart prepared by James Stanley; data derived from Tradingview
--- written by James Stanley, Senior Strategist
Latest market news
September 18, 2025 02:48 PM
June 23, 2025 01:22 PM
June 23, 2025 10:39 AM
June 20, 2025 05:23 PM
June 20, 2025 04:46 PM
June 20, 2025 03:35 PM

June 20, 2025 04:46 PM

June 20, 2025 03:35 PM

June 20, 2025 02:18 PM

June 20, 2025 12:21 PM