
View related analysis:
- Gold Rally Stalls Below Monthly High: Is a Deeper Pullback Brewing?
- Gold at Technical Crossroads Ahead of GDP, PCE; ASX 200 Stalls at Resistance
- AUD/USD, AUD/NZD Outlook: Trump–Xi Talks Spark USD Headwinds, Yen Strength
- AUD/JPY, GBP/JPY Outlook: Yen Slips as Trade Talk Optimism Boosts Risk Appetite
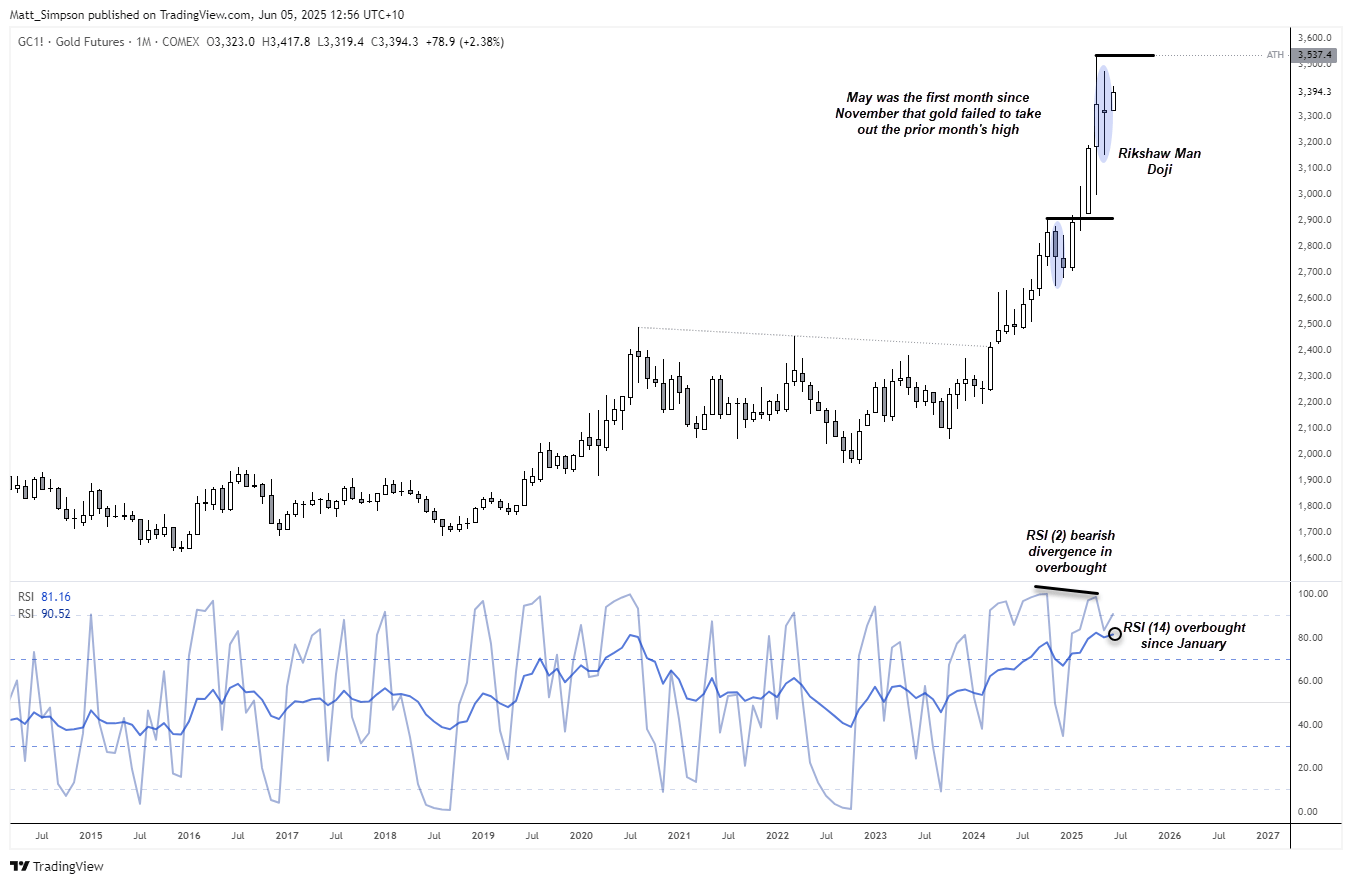
May was the first month since November that gold prices failed to take out the prior month’s high. This may not sound significant, but it is certainly a change of character from the rally that broke out in April 2024 and tells is that volatility is receding. Furthermore, April closed the month with a Rickshaw Man Doji, the monthly RSI (14) has been overbought since January, and a bearish divergence has formed on the monthly RSI (2) in its overbought zone.
Seasonality also suggests that a pullback in gold could be due, even if only a minor one.
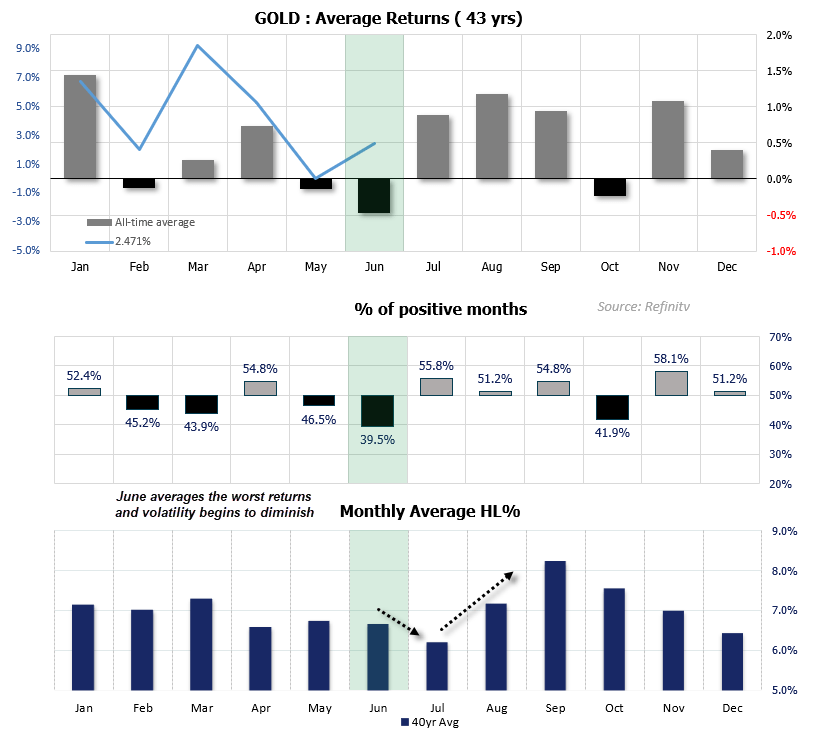
Gold Spot Price Analysis: 43-Year Seasonal Trends Suggest Bearish Tilt
I have used 43 years of spot gold data, the maximum data available under the Refinitiv subscription. The statistical dashboard shows:
- June has averaged the strongest negative returns (-0.5%)
- Gold has also seen the lowest ‘win’ rate of 39.5% in June (60.5% lose rate)
- June is the fourth smallest average range for gold, with a high-to-low range of 6.7%
- July has delivered the least volatile average range for gold of 6.2%
- Volatility tends to increase notably in August and peak in September, while average returns become increasingly positive
Ultimately, price action supports my suspicion that gold’s recent rally may have run its course. The metal’s inability to extend gains in May signals that a pullback could be due—aligning with gold’s historically bearish seasonality in June. That said, any retracement may be shallow, as volatility typically softens during mid-year months before rising again in August.

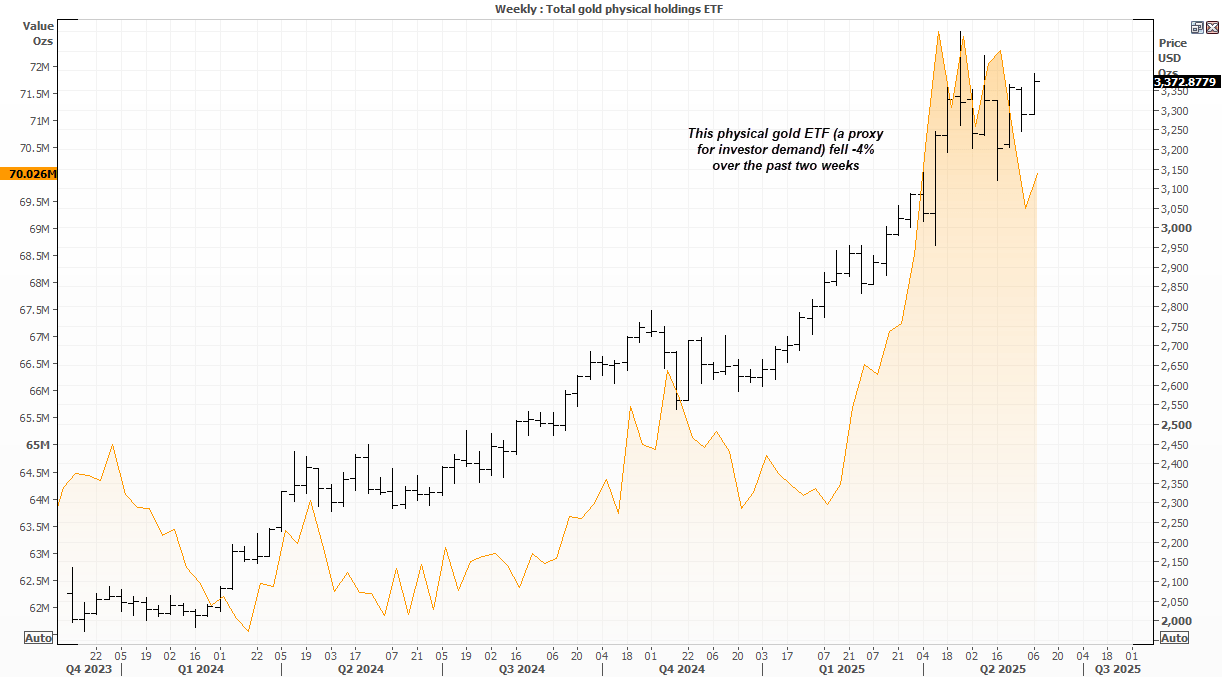
Gold Investment Demand Eases, Weighing on Bullish Outlook
We should also factor in lower gold demand from investors, as reflected by the ‘Total Gold Physical Holdings ETF’. The ETF has fallen by 4% over the past two weeks, even as gold prices have continued to grind higher. While this may not be a compelling sell signal on its own, it does serve as a cautionary sign — a reminder not to assume a swift return to record highs.
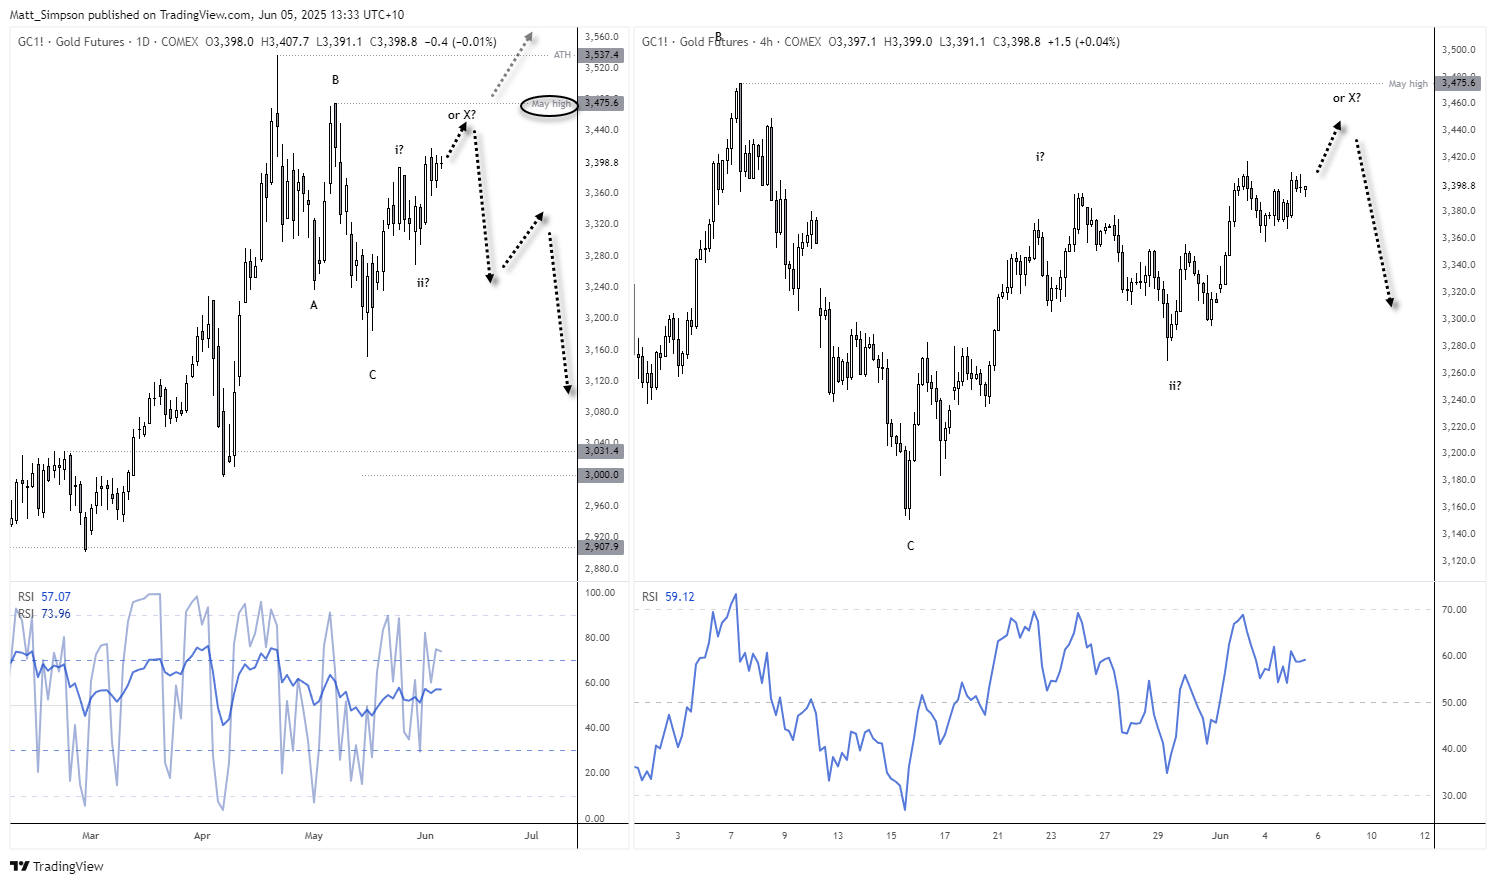
Gold Futures (GC) Technical Analysis
Like most markets at present, gold finds itself in a holding pattern and at the whim of Trump's trade headlines — supported, yet hesitant to trade above this week's high. Volatility is also suppressed while we await comments from FOMC members and Friday's NFP report.
Trump wasted no time urging Powell to cut rates in light of the ADP payrolls, and that benefited gold on Wednesday. Though the ADP has a terrible track record of predicting NFP. If anything, it points to a stronger jobs change figure, which could weigh on gold.
It is unclear whether gold has completed a simple ABC correction — which would suggest we’re now in a wave iii move higher — or if this is the connecting ‘x’ wave of a double or triple zig-zag, implying at least one more ABC leg lower.

- Given the tendency for negative returns in June and the lower gold ETF, my bias is for the current rally to peter out and recycle lower.
- This therefore assumes a stronger US dollar and positive developments with Trump’s trade talks.
- If prices roll over beneath the May high (3475.6) then it is assumed that the ‘x’ wave has been seem an prices should in theory recycle lower as part of another ABC correction.
- A break above 3475.6 invalidates the ‘double zig-zag’ idea and assumes a break to new highs.
-- Written by Matt Simpson
Follow Matt on Twitter @cLeverEdge
Latest market news
September 18, 2025 02:48 PM
June 23, 2025 01:22 PM
June 23, 2025 10:39 AM
June 20, 2025 05:23 PM
June 20, 2025 04:46 PM
June 20, 2025 03:35 PM

June 9, 2025 03:52 PM

June 6, 2025 05:41 PM

May 21, 2025 07:02 PM

May 20, 2025 06:58 PM