

Gold, XAU/USD Talking Points:
- Gold prices have been on a massive run since last February, gaining as much as 75% to test the $3,500 level in April.
- Since that April high bulls haven’t been able to prod a re-test of that big figure, and there’s been a showing of resistance at the $3350 level that remains in-play today.
- I look into gold each week during the price action webinar and you’re welcome to join the next. Click here to register.

Gold prices have just done something that they haven’t since the start of the massive rally began back in February of last year: Shown indecision on the monthly chart. While last February didn’t technically qualify as a doji as the body of that candle was a bit more than 5% of the period’s range, it was close, as the close was a mere $4.53 away from the opening price. But – it was also the start of a nine-month streak that saw the metal run all the way up to the 2790 level, eventually finding resistance around the U.S. Presidential election before a bull pennant built into the end of the year.
Buyers were back at it at the start of 2025 though, prodding an extension of that move all the way until the $3500 level traded, albeit briefly, around the Easter Monday holiday. This was around the same time that the USD was testing a massive spot of long-term support that, so far, has held as the low for the year.
But it’s what happened after that’s of interest, as the month of May showed a near perfect doji candlestick as buyers were unable to drive up for a re-test of that prior high at $3500. The change for the month was a mere $0.79, but perhaps more notably, it was the lower-high that shows a bit of fatigue in the move and the monthly RSI reading remains heavily overbought above the 85 level.
Gold Monthly Chart
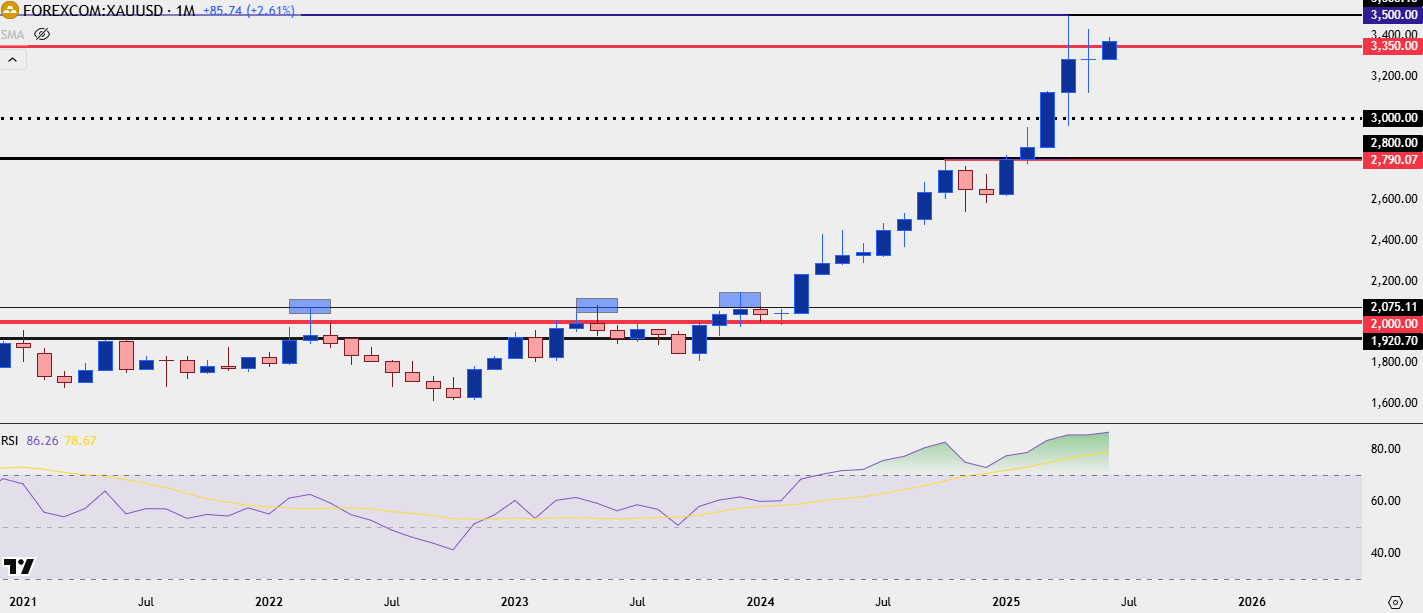 Chart prepared by James Stanley; data derived from Tradingview
Gold: Indecision Doesn’t Have to be ‘Bad’
Normally when a show of indecision appears after a massive rally, the expectation is for some element of pullback. And given the size of the move in gold, that certainly remains a possibility. But, it’s important to draw back to other dojis on the monthly chart to see that not every show of indecision has amounted to a reversal.
It does, however, mark the possibility of change and that’s what’s of interest as we move into June trade.
Like I said in yesterday’s webinar, I wouldn’t yet want to count out gold bulls as they’ve shown an insatiable demand upon tests of key supports. This is similar to the setup looked at in the webinar a few weeks ago, when the 3150 level was in-play. Or then again a week later when 3250 was coming in as support.
It would simply be too early to say that the run is finished as bulls have continued to hold higher-low supports. At this point, we’re still early in June trade but there’s another level of importance on a shorter-term basis, and that’s the $3350 level that’s stalled bulls for the past seven and a half weeks. Gold is testing above that price right now, and even showing some short-term support as I’ll look at in the next chart. But, as you can see from the weekly below that’s a massive spot of importance for shorter-term themes in gold.
Gold Weekly Chart
 Chart prepared by James Stanley; data derived from Tradingview
Gold Daily
The problem for gold bulls hasn’t been support, it’s been resistance as early-May showed a lower-high at $3435, well inside of the prior high-water mark at $3500. That led to another lower-high in late-May around the $3350 level, but as you can see from below, bulls have now traded above that and there’s even a show of support at that level of prior resistance.
As I discussed in yesterday’s webinar, this keeps the door open for short-term momentum strategies in gold, looking for a push up towards that prior lower-high of $3435. The bigger question at that point is whether bulls can rally all the way up to the $3500 level.
In my opinion, the more attractive back drop in gold remains short-term counter-trend, just as we saw a few weeks ago with the test of support around 3150 or then again, on a shorter-term basis, with last week’s test of 3250. Ideally, support would remain above the $3300 level which is currently confluent with a bullish trendline, but even if gold does put in a lower-low, similar to that mid-May episode, there could be remaining scope for support to play at a $3250 or even a $3100 or $3k type of level.
Gold Daily Chart
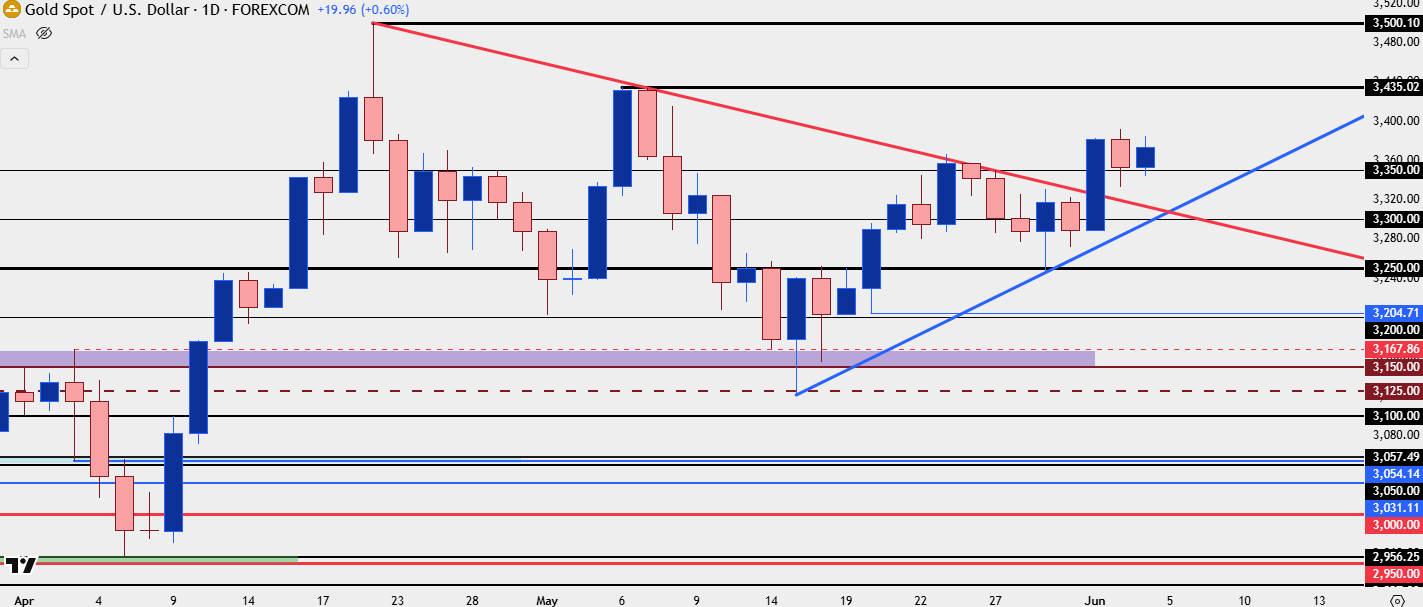 Chart prepared by James Stanley; data derived from Tradingview
--- written by James Stanley, Senior Strategist
Latest market news
Yesterday 11:00 PM
Yesterday 07:48 PM
Yesterday 06:55 PM