

Over the past few weeks, I’ve noted that gold’s almighty rally is showing signs of exhaustion on the higher timeframes. Not only has price action delivered several twists and turns since its latest all-time high (ATH) in April, but the weekly charts show overlapping candles, and a Rickshaw Man doji formed on the monthly chart in May.
Moreover, May marked the first month since November that bulls failed to push gold prices above the prior month’s high. While none of this guarantees a strong bearish reversal, it does at least signal a clear change in the character of price action compared with the almost parabolic rally seen since January.
Only time will tell whether bears will be treated to a larger decline or simply lulled into another bear trap. But for now, a near-term bearish setup may have surfaced on gold’s daily chart to keep them occupied.
View related analysis:
- Gold Outlook: Seasonal Weakness and Fading Momentum Hint at June Pullback
- Japanese Yen Slides: USD/JPY, AUD/JPY Rally on Risk Optimism
- USD Net Shorts Hit Record as AUD Bears Rise, CAD and EUR Gain – COT Report
- AUD/USD Weekly Forecast: Fed Decision and Australian Jobs Eyed
Gold Bearish Reversal Pattern Forms Near May High
A two-bar bearish reversal pattern (dark cloud cover) has formed on the gold daily chart, signalling a potential swing high for gold prices. That it occurred at the May high adds further weight to the case for at least a minor pullback — potentially toward the $3,313 support level.
The potential for a larger gold price correction, such as a double zig-zag, remains in play while gold holds beneath the May high. This corrective pattern implies another ABC move lower, which brings the $3,000–$3,031 support zone into focus. However, such a deeper retracement would likely require a strong risk-on environment. For now, the bias remains for a pullback toward $3,313, with the outlook to be refined as gold market conditions evolve.
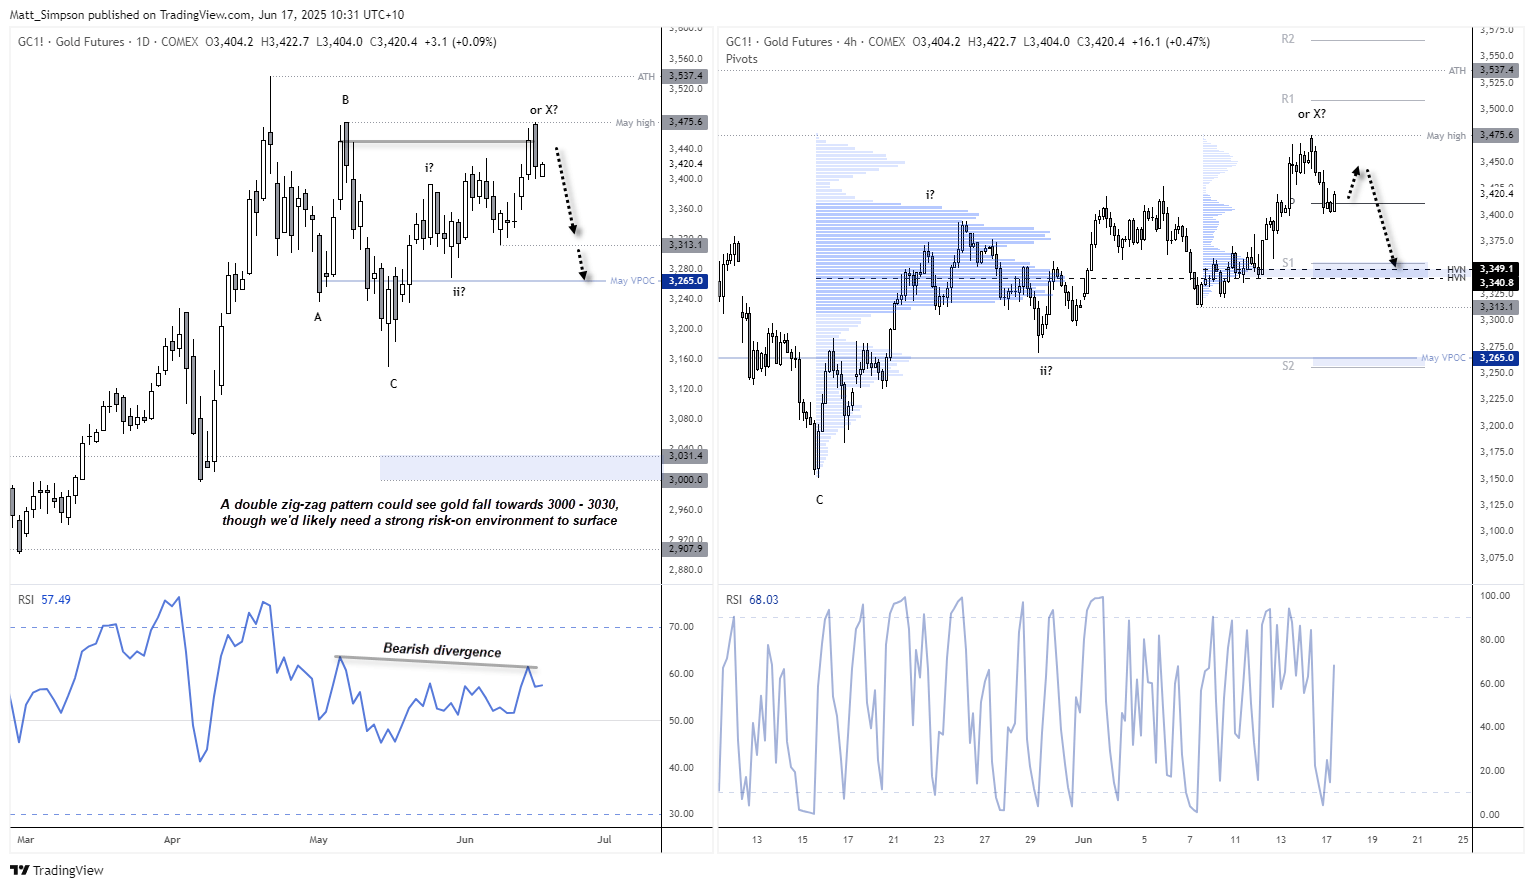
Gold Futures Eye Support Near $3,340–$3,355 on 1-Hour Chart
The 1-hour chart shows gold is attempting to carve out a swing low above $3,400, currently trading around its weekly pivot point. The RSI (14) has rebounded from oversold territory and formed a small bullish divergence, suggesting that a minor bounce may be due.
Gold bears could look to fade into minor moves within Tuesday’s range, maintaining a bearish bias while prices remain beneath Monday’s high. Note that the weekly S1 pivot at $3,354.70 aligns just above two high-volume nodes (HVNs), making the $3,340–$3,355 zone a potential near-term support level — just above the key $3,313 swing low.

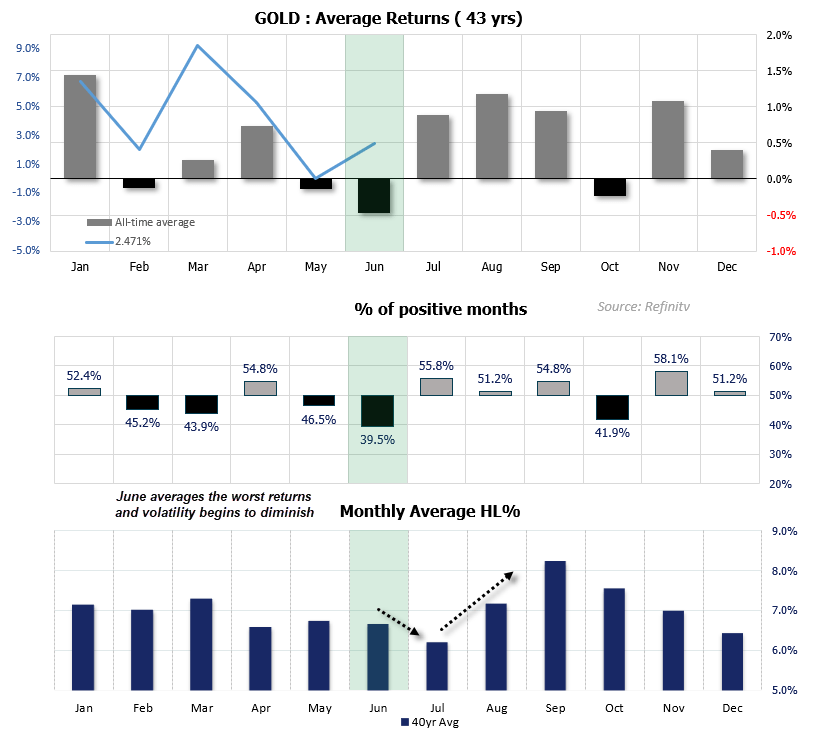
Gold June Seasonality Shows Lowest Win Rate of the Year
It is also worth noting Gold has averaged the strongest negative monthly return in June, using futures data over the past 43 years. Gold has also closed lower 60.5% of the time in June which is the lowest win rate of 39.5% compared to any other month in the year.
-- Written by Matt Simpson
Follow Matt on Twitter @cLeverEdge
Latest market news
September 18, 2025 02:48 PM
June 23, 2025 01:22 PM
June 23, 2025 10:39 AM
June 20, 2025 05:23 PM
June 20, 2025 04:46 PM
June 20, 2025 03:35 PM

February 10, 2025 08:45 PM

February 1, 2025 02:00 AM

January 1, 2025 07:30 AM

December 23, 2024 02:45 PM