

Gold Price Outlook: XAU/USD
The price of gold appears to be pulling back ahead of the record high ($2956) as it snaps the series of higher highs and lows from the start of the week.
Gold Price Outlook Hinges on Response to Positive Slope in 50-Day SMA
In turn, the price of gold may consolidate within the February range amid the failed attempt to push above the weekly high ($2930), but bullion may reestablish the bullish trend from earlier this year should it track the positive slope in the 50-Day SMA ($2800).
Join David Song for the Weekly Fundamental Market Outlook webinar.
David provides a market overview and takes questions in real-time. Register Here
With that said, the range bound price action in bullion may turn out to be temporary as it continues to offer an alternative to fiat currencies, but the price of gold may continue to give back the advance from the February low ($2772) if it struggles to hold above the moving average.
XAU/USD Price Chart – Daily
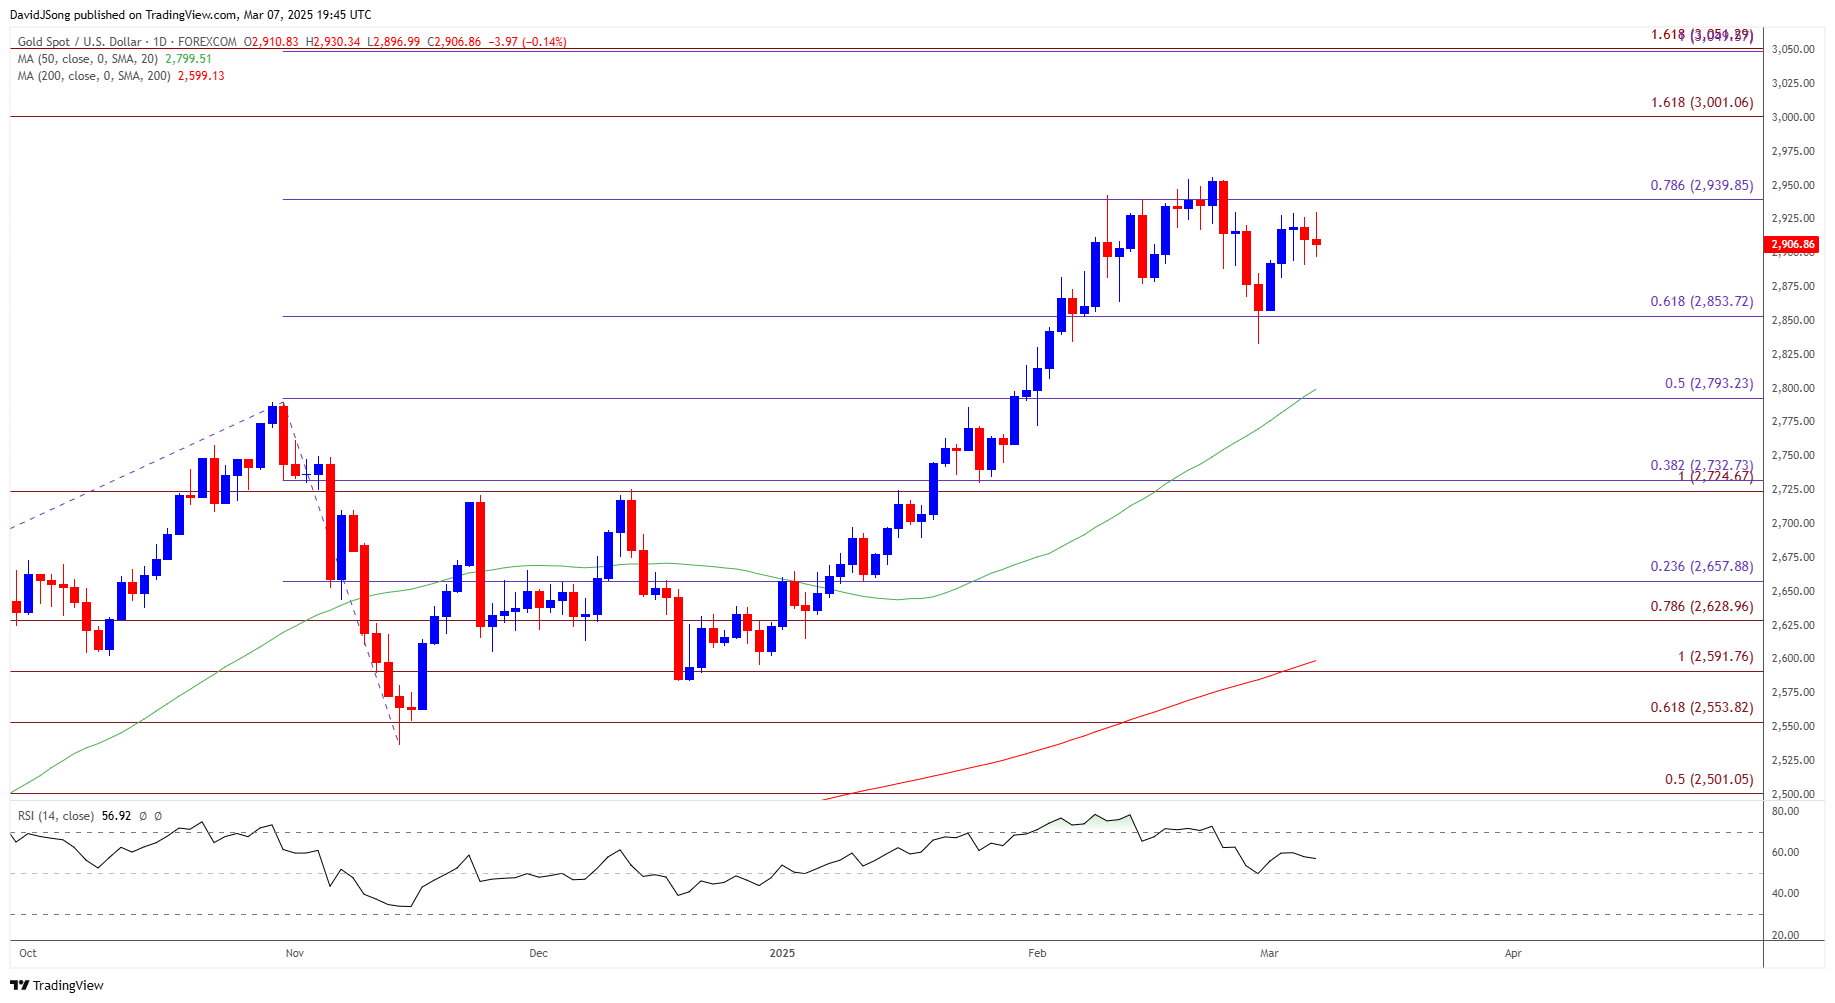
Chart Prepared by David Song, Senior Strategist; XAU/USD on TradingView
- The price of gold hold below the weekly high ($2930) as it snaps the recent series of higher highs and lows, with a break/close below $2850 (61.8% Fibonacci extension) raising the scope for a move towards $2790 (50% Fibonacci extension).
- Next area of interest comes in around the February low ($2772), but the price of gold may track the positive slope in the 50-Day SMA ($2800) if it continues to hold above the moving average.
- Need a move above $2940 (78.6% Fibonacci extension) to bring the February high ($2956) on the radar, with the next region of interest coming in around $3000 (161.8% Fibonacci extension).
Additional Market Outlooks
British Pound Forecast: GBP/USD Holds Above Channel Resistance
EUR/USD Rally Persist Even as ECB Pursues Less Restrictive Policy
AUD/USD Rebounds Even as Trump Tariffs Go into Effect for China
Canadian Dollar Forecast: USD/CAD Rally Persists with Trump Tariffs on Track
--- Written by David Song, Senior Strategist
Follow on X at @DavidJSong

Latest market news
September 18, 2025 02:48 PM
June 23, 2025 01:22 PM
June 23, 2025 10:39 AM
June 20, 2025 05:23 PM
June 20, 2025 04:46 PM
June 20, 2025 03:35 PM

September 18, 2025 02:48 PM

June 18, 2025 07:38 PM
June 18, 2025 03:24 PM

June 17, 2025 07:15 PM