

Gold Technical Outlook: XAU/USD Short-term Trade Levels
- Gold prices mark second weekly decline after reversing off trend resistance
- XAU/USD break of technical support threatens test of November uptrend- Fed on tap
- Resistance 3272/88, 3320 (key), 3381- Support ~3180s, 3131/32 (key), 3018
Gold prices are poised to close a second consecutive weekly decline with XAU/USD falling more than 8.5% from last month’s record high. A break below slope support this week threatens a deeper correction within the uptrend with the bulls eyeing support ahead of next week’s FOMC meeting. Battle lines drawn on the short-term gold technical charts.
Review my latest Weekly Strategy Webinar for an in-depth breakdown of this gold technical setup and more. Join live on Monday’s at 8:30am EST.Gold Price Chart – XAU/USD Daily
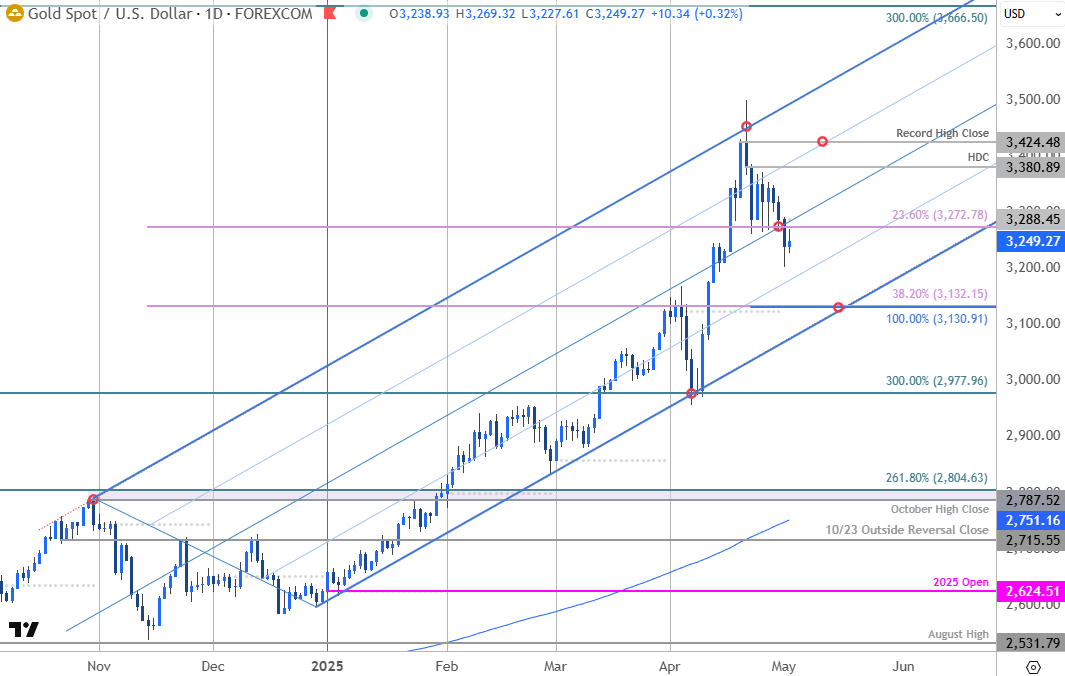
Chart Prepared by Michael Boutros, Sr. Technical Strategist; XAU/USD on TradingView
Technical Outlook: Gold prices have been trading within the confines of an ascending pitchfork extending off the late-December low with XAU/USD reversing off the upper parallel last month. The subsequent pullback broke below the median-line yesterday at the 23.6% retracement of the November advance at 3272 and threatens a deeper pullback in the days ahead.
Gold Price Chart – XAU/USD 240min
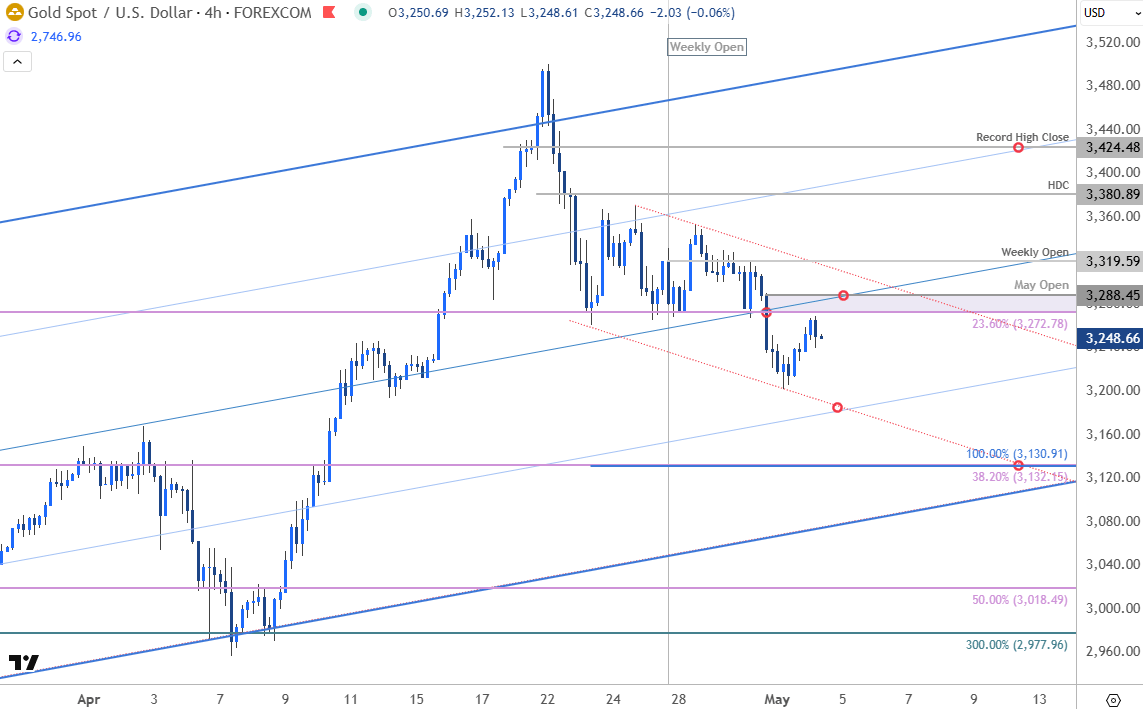
Chart Prepared by Michael Boutros, Sr. Technical Strategist; XAU/USD on TradingView
Notes: A closer look at gold price action shows XAU/USD breaking the weekly opening-range on Wednesday with price trading just below the median-line on the heels of today’s NFP release. Initial support rests with the highlighted slope confluence near ~3180 and is backed by 3131/32- a region defined by the 100% extension of the April decline and the 38.2% retracement of the November advance. Ultimately, a break / close below pitchfork support would be needed to invalidate the November uptrend / suggest a larger reversal is underway.
Initial resistance extends in the objective weekly open at 3272/88 with a close above the weekly open at 3320 needed to suggest a more significant low is in place. Subsequent resistance objectives are eyed at the record high-day close (HDC) at 3381 and the record high-close at 3424- look for a larger reaction there IF reached.

Bottom line: Gold has slipped below uptrend support for the first time since the April breakout and threatens a deeper correction while below the median-line. From a trading standpoint, losses should be limited to 3131 / the lower parallel IF price is heading higher on this stretch with a close above 3319 needed to fuel another attempt at the highs.
Keep in mind we in the early throws of the May opening-range with the Federal Reserve interest rate decision on tap next week. Stay nimble into the release and watch the weekly close here for guidance.
Key Economic Data Releases
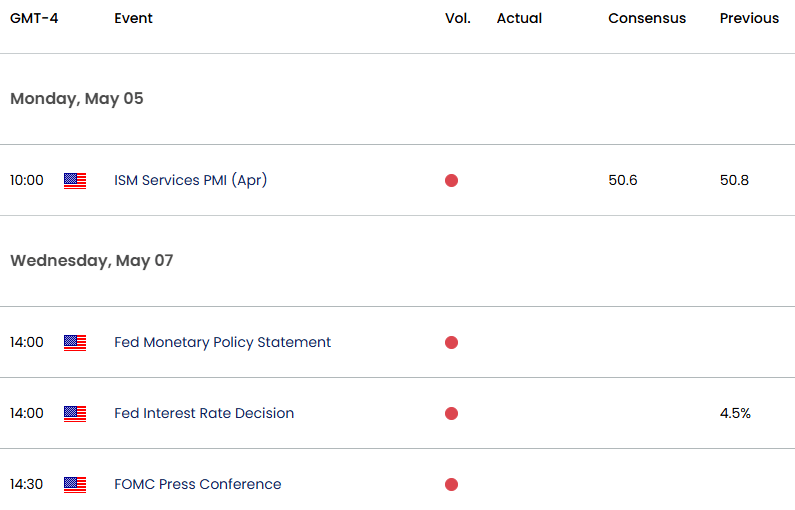
Economic Calendar - latest economic developments and upcoming event risk.
Active Short-term Technical Charts
- US Dollar Short-term Outlook: USD Bulls Emerge Ahead of NFP
- Euro Short-term Outlook: EUR/USD Breakout Looms, NFP on Tap
- Japanese Yen Short-term Outlook: USD/JPY Coils Ahead of BoJ, NFP
- British Pound Short-term Outlook: GBP/USD Bulls Eye 2024 High
- Australian Dollar Short-term Outlook: AUD/USD Halted at Resistance
- Canadian Dollar Short-term Outlook: USD/CAD Breakout Imminent
--- Written by Michael Boutros, Sr Technical Strategist with FOREX.com
Follow Michael on X @MBForex
Latest market news
September 18, 2025 02:48 PM
June 23, 2025 01:22 PM
June 23, 2025 10:39 AM
June 20, 2025 05:23 PM
June 20, 2025 04:46 PM
June 20, 2025 03:35 PM

June 9, 2025 03:52 PM

June 6, 2025 05:41 PM

May 21, 2025 07:02 PM

May 20, 2025 06:58 PM