

Japanese Yen Technical Forecast: USD/JPY Short-term Trade Levels
- USD/JPY pares early-week advance- reverses sharply off Fibonacci resistance
- USD/JPY bears eye break of May lows to mark resumption- U.S. Core PCE, NFPs on tap
- Resistance 146.15, 147.25 (key), 148.39/65- Support 143.05, 142.35 (key), 141.56
The U.S. Dollar is set to snap a three-day winning streak against the Japanese Yen with USD/JPY reversing sharply off Fibonacci resistance today. The move threatens resumption of the broader downtrend, and the focus is on a break of the monthly range to fuel the next leg. Battle lines drawn on the USD/JPY short-term technical charts.
Review my latest Weekly Strategy Webinar for an in-depth breakdown of this Yen setup and more. Join live on Monday’s at 8:30am EST.Japanese Yen Price Chart – USD/JPY Daily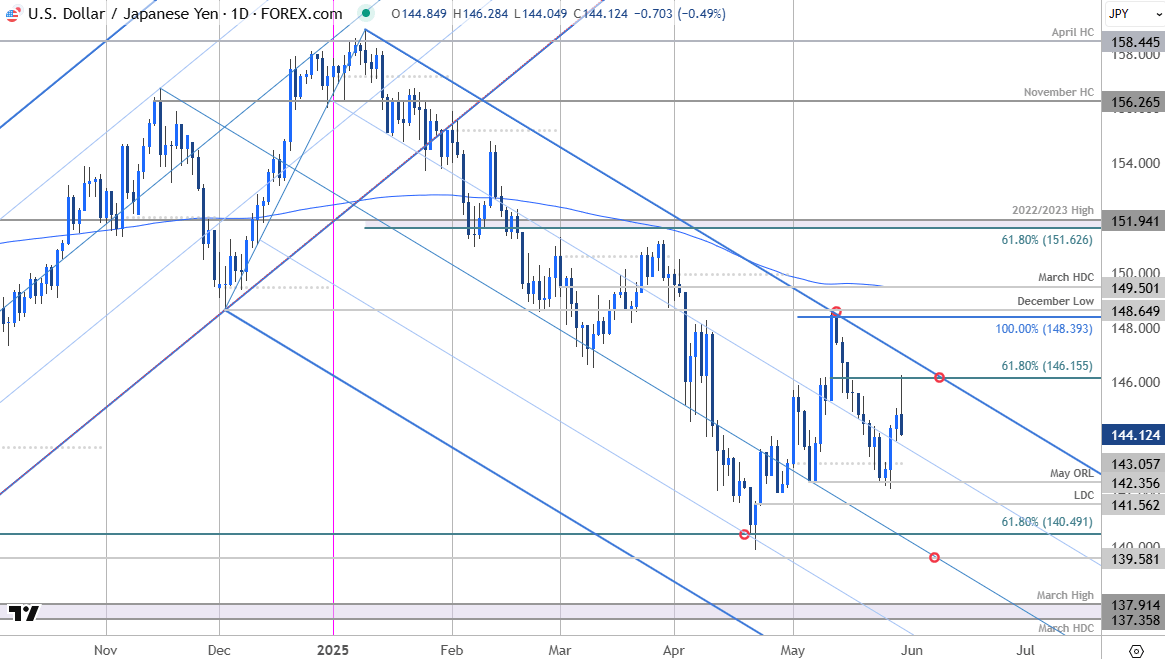
Chart Prepared by Michael Boutros, Sr. Technical Strategist; USD/JPY on TradingView
Technical Outlook: In my last Japanese Yen Short-term Outlook, we noted that USD/JPY had, “has responded to confluent downtrend resistance with the pullback now approaching initial support and the first test for the bulls.” Support broke the following week with a 4.4% plunge off the highs rebounding off the monthly range lows on Monday. The rebound failed today at the 61.8% retracement of the monthly range with USD/JPY now off more than 1.5% from those highs. The immediate focus is on this pullback with a break of the monthly range lows needed to mark resumption of the broader downtrend.
Japanese Yen Price Chart – USD/JPY 240min
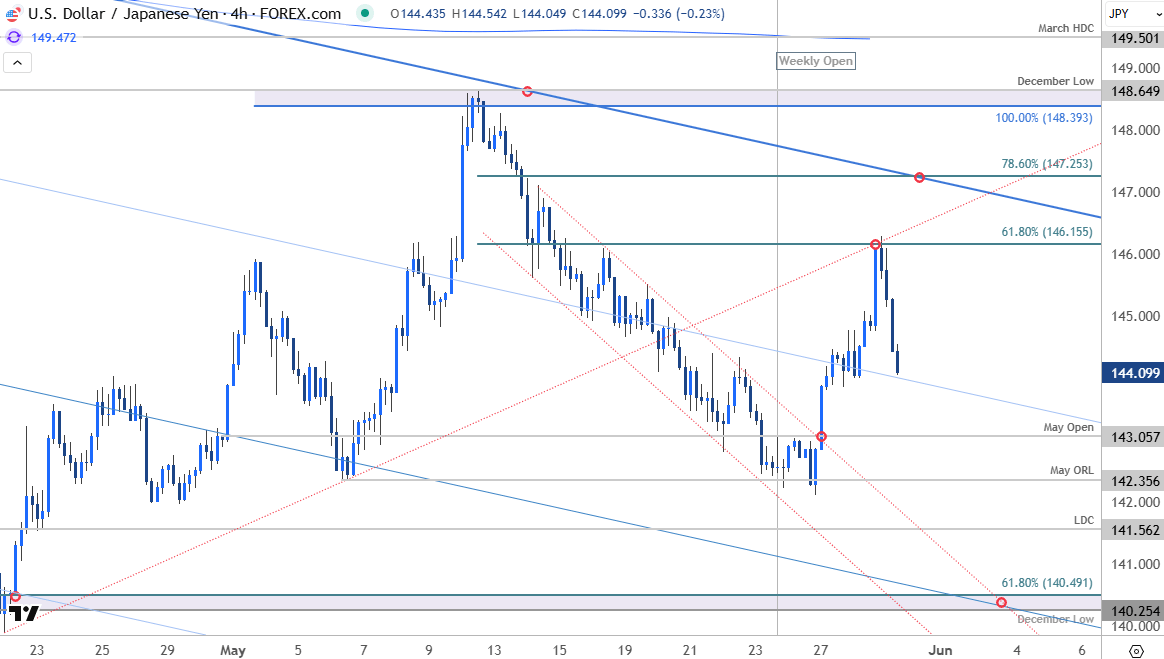
Chart Prepared by Michael Boutros, Sr. Technical Strategist; USD/JPY on TradingView
A closer look at Japanese Yen price action shows USD/JPY reversing off confluent resistance at former slope support (red) with the pullback now approaching the 75% parallel of the pitchfork we’ve been tracking off the yearly high. Monthly open support rests at 143.06 and is backed by the May opening-range lows (ORL) at 142.35. A break below this threshold exposes the yearly low day close (LDC) at 141.56 and key support at the December lows / 61.8% retracement of the 2023 advance at 140.25/49- look for a larger reaction there IF reached.
Initial resistance stands at 146.15 and is backed by the 78.6% retracement at 147.25. A topside breach / close above the upper parallel (blue) is needed to invalidate the yearly downtrend with subsequent objectives eyed at 148.39/65 and the 200-day moving average / March high-day close (HDC) around 149.46/50.

Bottom line: USD/JPY exhausted into technical resistance this month with today’s reversal threatening resumption of the broader downtrend. From a trading standpoint, rallies should be limited to 147.25 IF price is heading lower on this stretch with a close below the monthly range needed to fuel the next leg of the decline.
Keep in mind we get the release of key U.S. inflation data into the monthly cross with Non-Farm Payrolls on tap next week. Stay nimble into the releases and watch the weekly close here for guidance. Review my latest Japanese Yen Weekly Forecast for a closer look at the longer-term USD/JPY technical trade levels.
USD/JPY Key Economic Data Releases
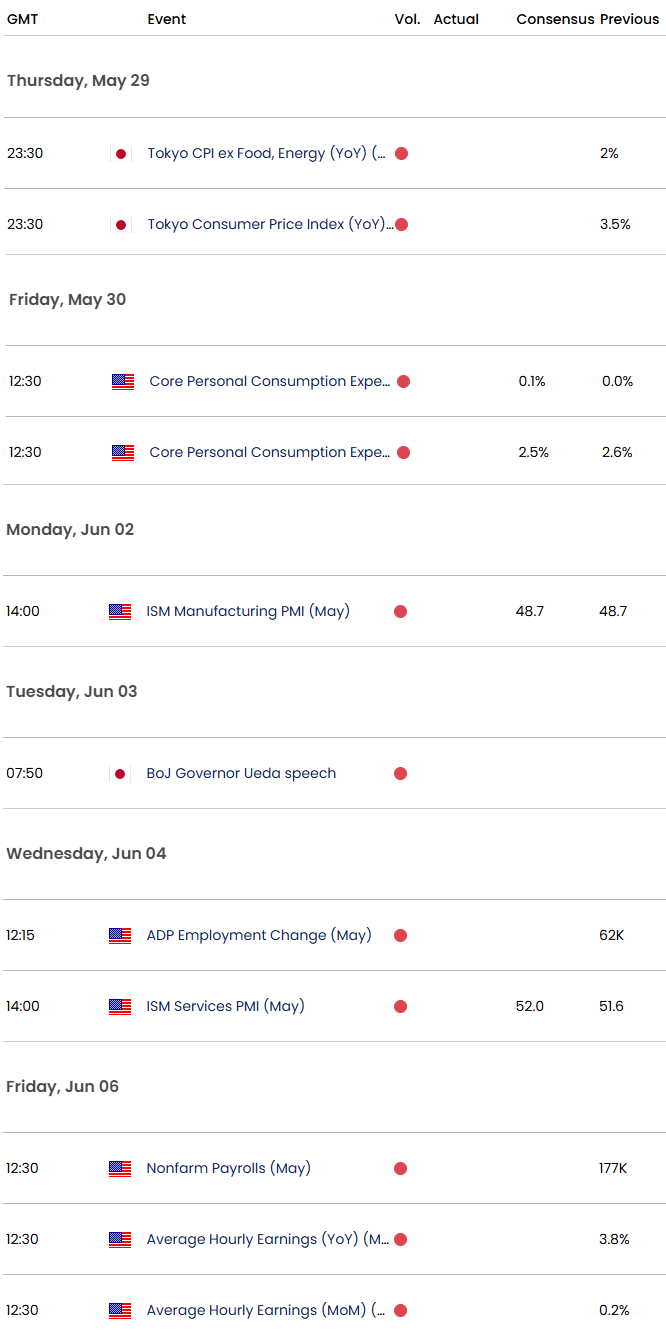
Economic Calendar - latest economic developments and upcoming event risk.
Active Short-term Technical Charts
- Canadian Dollar Short-term Outlook: USD/CAD Reversal Risk Builds
- US Dollar Short-term Outlook: USD Reversal Keeps 2025 Downtrend Intact
- British Pound Short-term Outlook: GBP/USD Threatens Major Breakout
- Australian Dollar Short-term Outlook: AUD/USD Breakout Imminent
- Gold Short-term Outlook: XAU/USD Bulls Defend Make-or-Break Support
- Euro Short-term Outlook: EUR/USD Recovery Stalls at Trend Resistance
- Swiss Franc Short-term Outlook: USD/CHF Bulls Tested at Resistance
--- Written by Michael Boutros, Sr Technical Strategist
Follow Michael on X @MBForexLatest market news
September 18, 2025 02:48 PM
June 23, 2025 01:22 PM
June 23, 2025 10:39 AM
June 20, 2025 05:23 PM
June 20, 2025 04:46 PM
June 20, 2025 02:18 PM

June 19, 2025 09:09 AM

June 18, 2025 02:55 PM

June 18, 2025 08:19 AM

June 18, 2025 02:21 AM