

Japanese Yen Talking Points:
- Japanese Yen strength showed against the U.S. Dollar in the aftermath of this morning’s U.S. CPI report.
- While questions remain around the Fed’s ability to cut rates this year, both Europe and the U.K. could drive bearish fundamental backdrops, making the prospect of carry unwind in GBP/JPY and EUR/JPY as more attractive concepts.
- I look into these pairs each week in the Tuesday webinar, and you’re welcome to join: Click here for registration information.
USD/JPY Support Break
The U.S. Dollar showed a move of weakness around the U.S. CPI print this morning, and while DXY has bounced back and the EUR/USD sell-off has caught another shot-in-the-arm, USD/JPY is holding relatively close to the morning’s lows.
There’s also the breach of a support zone that had showed as prior resistance, taken from the 76.4 and 78.6% Fibonacci retracements of the July-September sell-off. This zone had previously helped to hold resistance in November, but more recently it had helped to hold support over the past two weeks, until this morning’s breach down to a lower-low.
USD/JPY Daily Price Chart
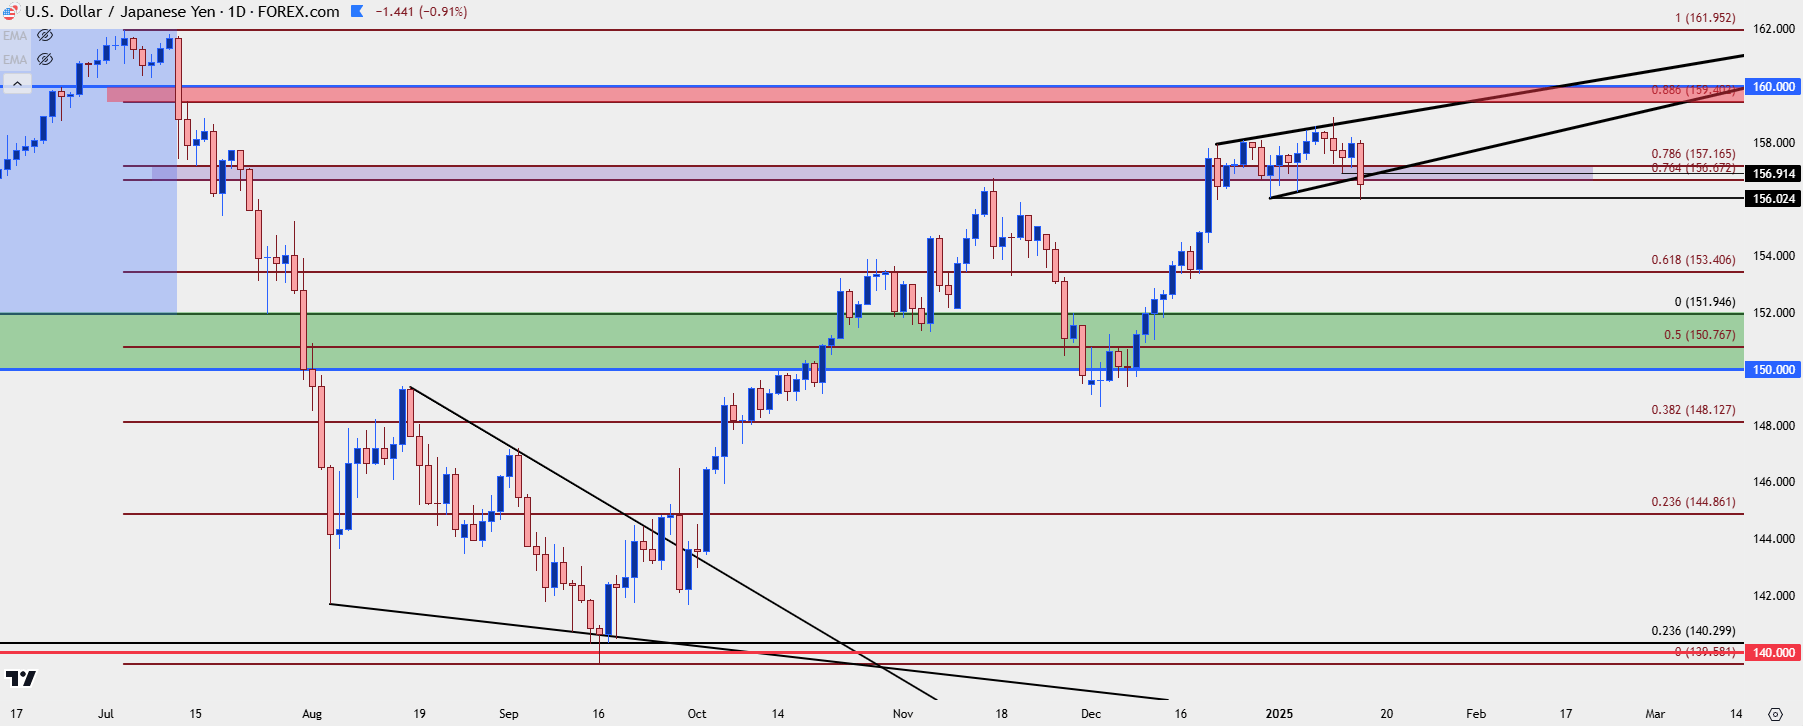 Chart prepared by James Stanley, USD/JPY on Tradingview

USD/JPY Four-Hour
On a shorter-term basis we can see where this morning’s sell-off brought upon a fresh 2025 low in the pair; but the bounce from that has, so far, held resistance at the bottom of the support zone noted above.
For overhead resistance, there’s a prior swing-low at 156.91 and the top of the Fibonacci zone at 157.17. And for next support below the 156.00 handle, it’s the 155.00 psychological level that looms large.
USD/JPY Four-Hour Chart
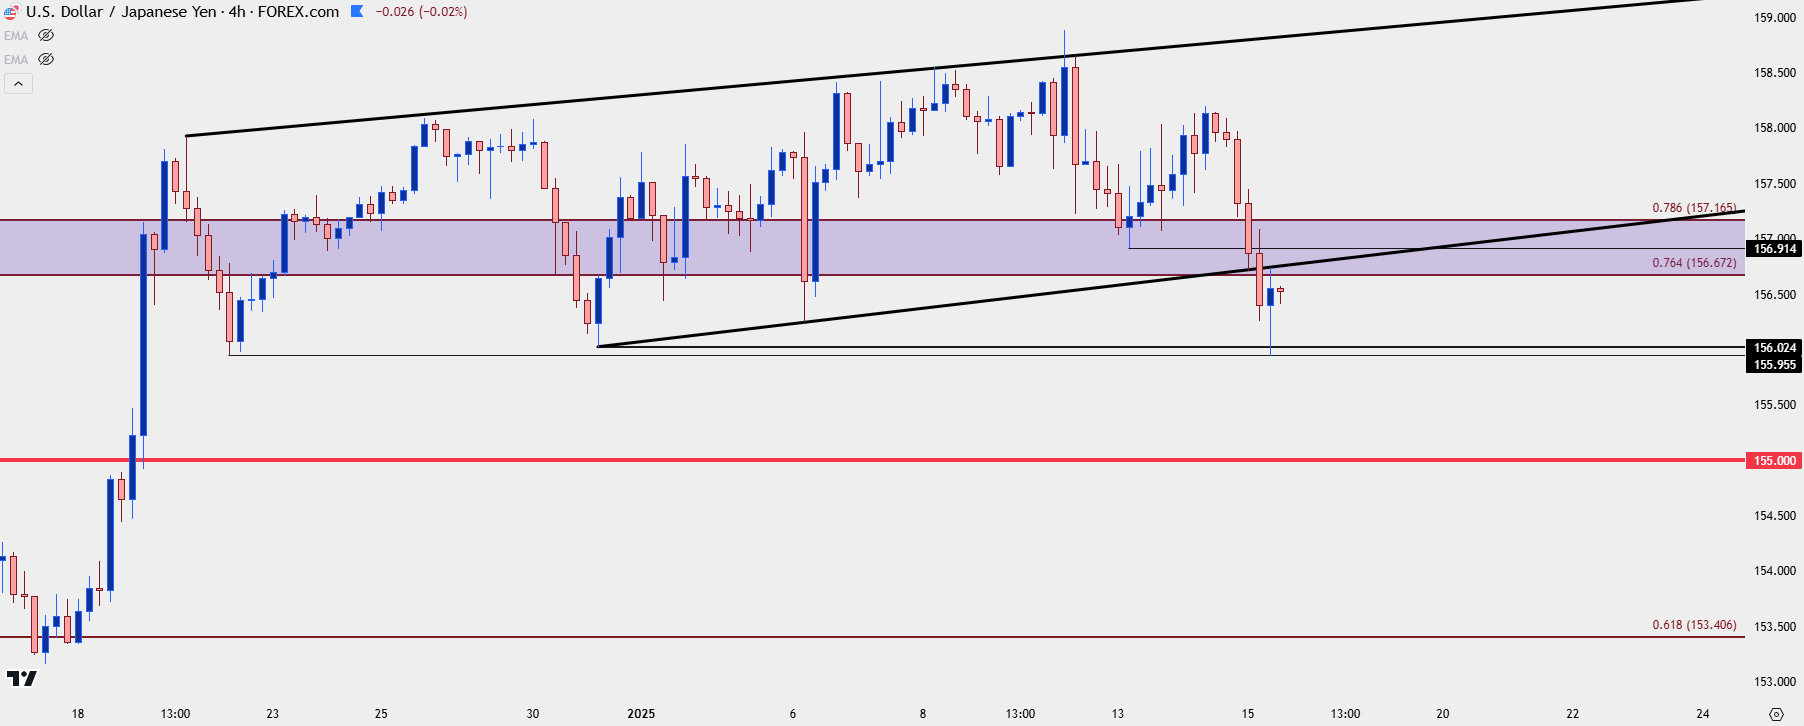 Chart prepared by James Stanley, USD/JPY on Tradingview
GBP/JPY
It’s been a slippery start to the year for the British Pound and I had looked at GBP/JPY in the weekly forecast, highlighting a bearish backdrop as prices had started to push below a long-term zone. Monday saw another spill in GBP/JPY and the pair made a fast push down to the 190.00 handle before catching a sizable bounce. Resistance held overnight at 193.00 and sellers have went back for another run, but chasing this at this point could be a challenge.
From the weekly chart below, we can see a longer-term trend that’s come more and more into question, as shown by lower-highs over the past six months. But if the pair gives up the 190.00 level, the door could soon open to breakdown scenarios.
GBP/JPY Weekly Chart
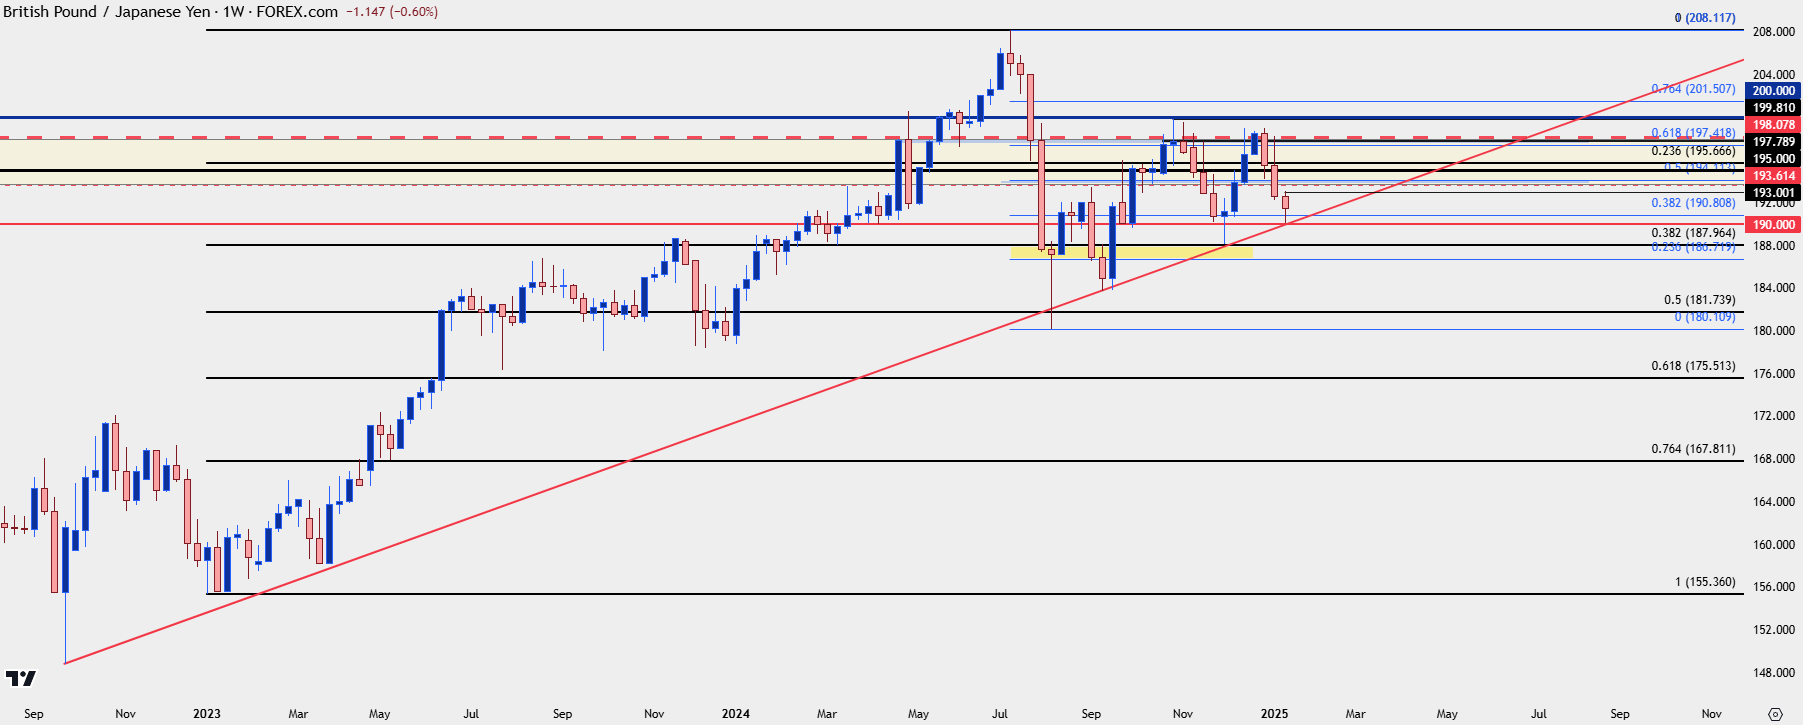 Chart prepared by James Stanley, GBP/JPY on Tradingview
GBP/JPY Four-Hour
Given how quickly the pair has moved off of that 193.00 level, chasing could be challenging. But, there’s also context for a lower-high around the 192.40 level; and if that doesn’t come into the picture, the 190.81 Fibonacci level could potential be used to work with breakdown scenarios into the 190.00 psychological level.
GBP/JPY Four-Hour Price Chart
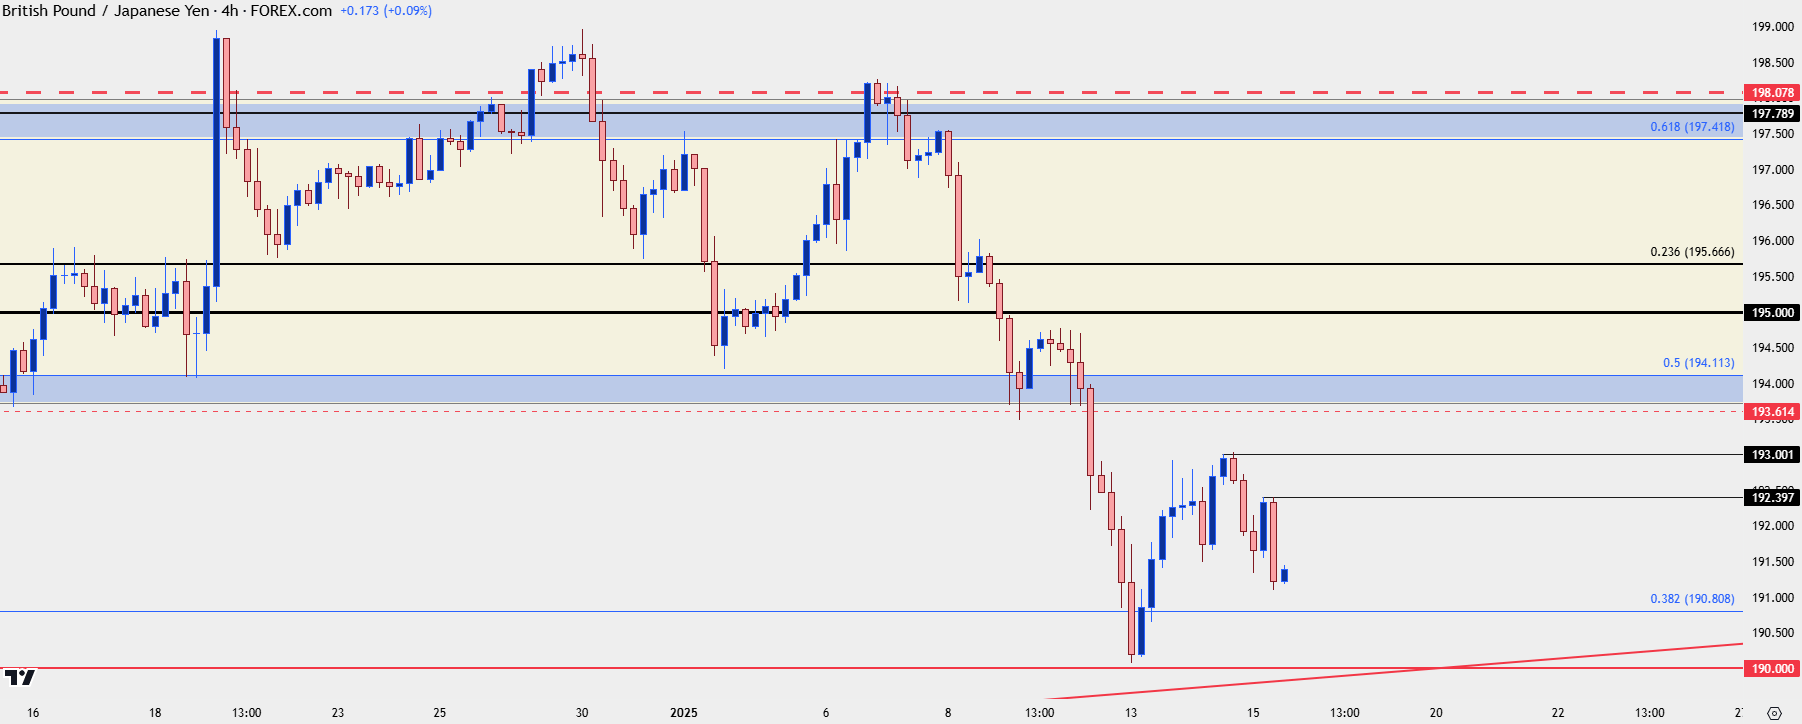 Chart prepared by James Stanley, GBP/JPY on Tradingview
EUR/JPY
EUR/JPY is currently within a symmetrical triangle formation and earlier this week, it was around the 160.00 level that had held the lows after bears attempted to continue the sell-off that started after resistance at the 165.00 level around the end of 2024.
Similar to GBP/JPY above, that can be a tough move to chase. But the weekly chart shows the bigger-picture where, if we do see a notable sell-off and a breach of recent congestion, a longer-term move could come into play.
EUR/JPY Weekly Chart
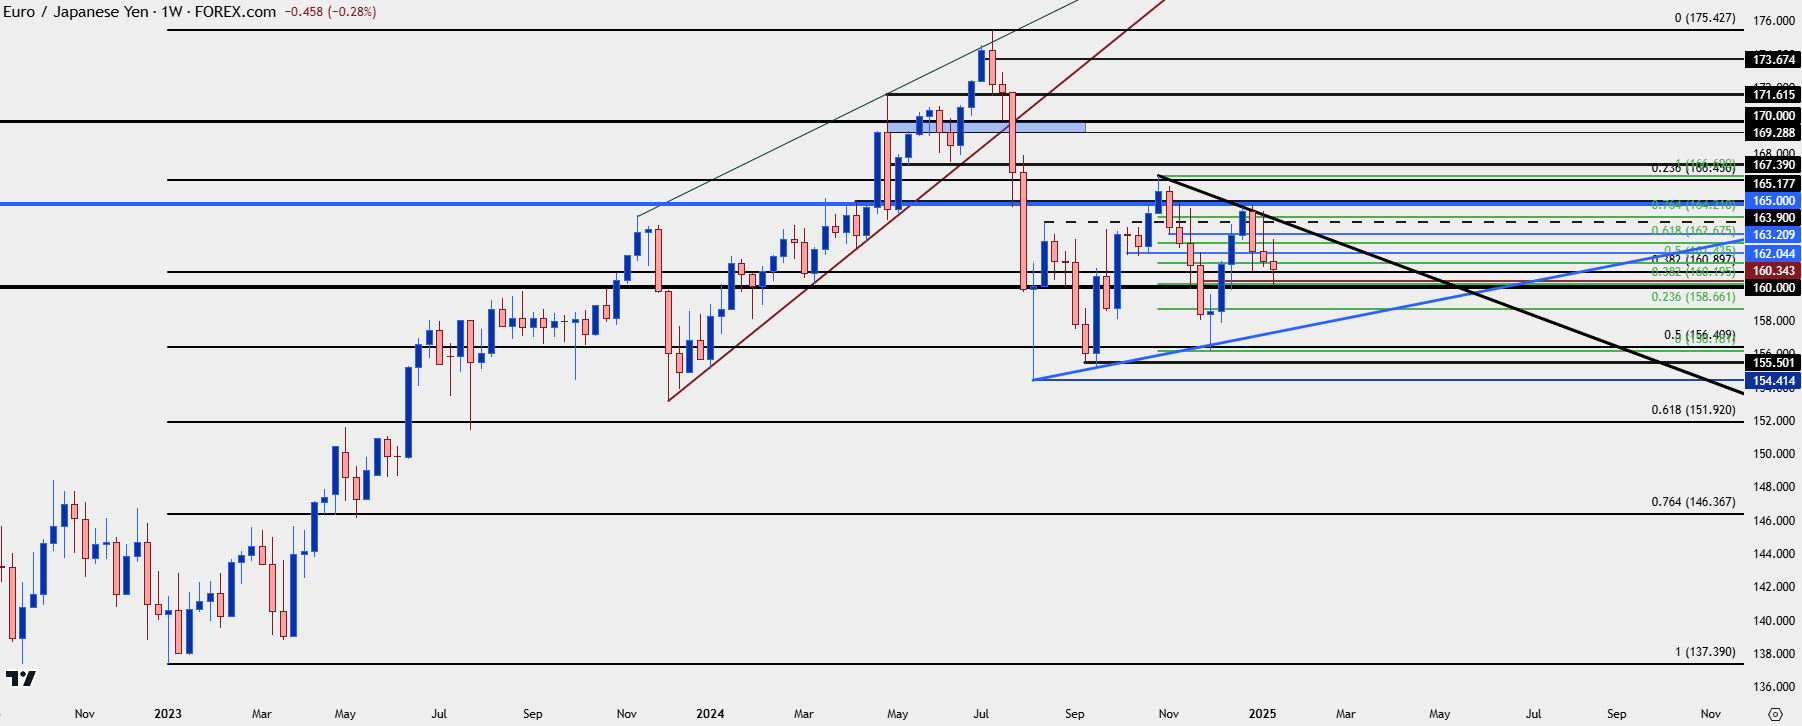 Chart prepared by James Stanley, EUR/JPY on Tradingview
EUR/JPY Four-Hour
From the four-hour chart of EUR/JPY, we can see another Fibonacci level coming into play at 160.90 to help hold the lows so far today. This is quite near the earlier week swing low and this could, again, be a challenging place to chase price-lower. But – it does highlight lower-high resistance potential at 161.44 or 162.04, both of which could keep the door open for a 160.00 test.
Or – if no pullback shows, a breach of 160.00 opens the door to bigger picture breakdown potential, with the next notable level-lower the Fibonacci level at 158.66.
EUR/JPY Four-Hour Chart
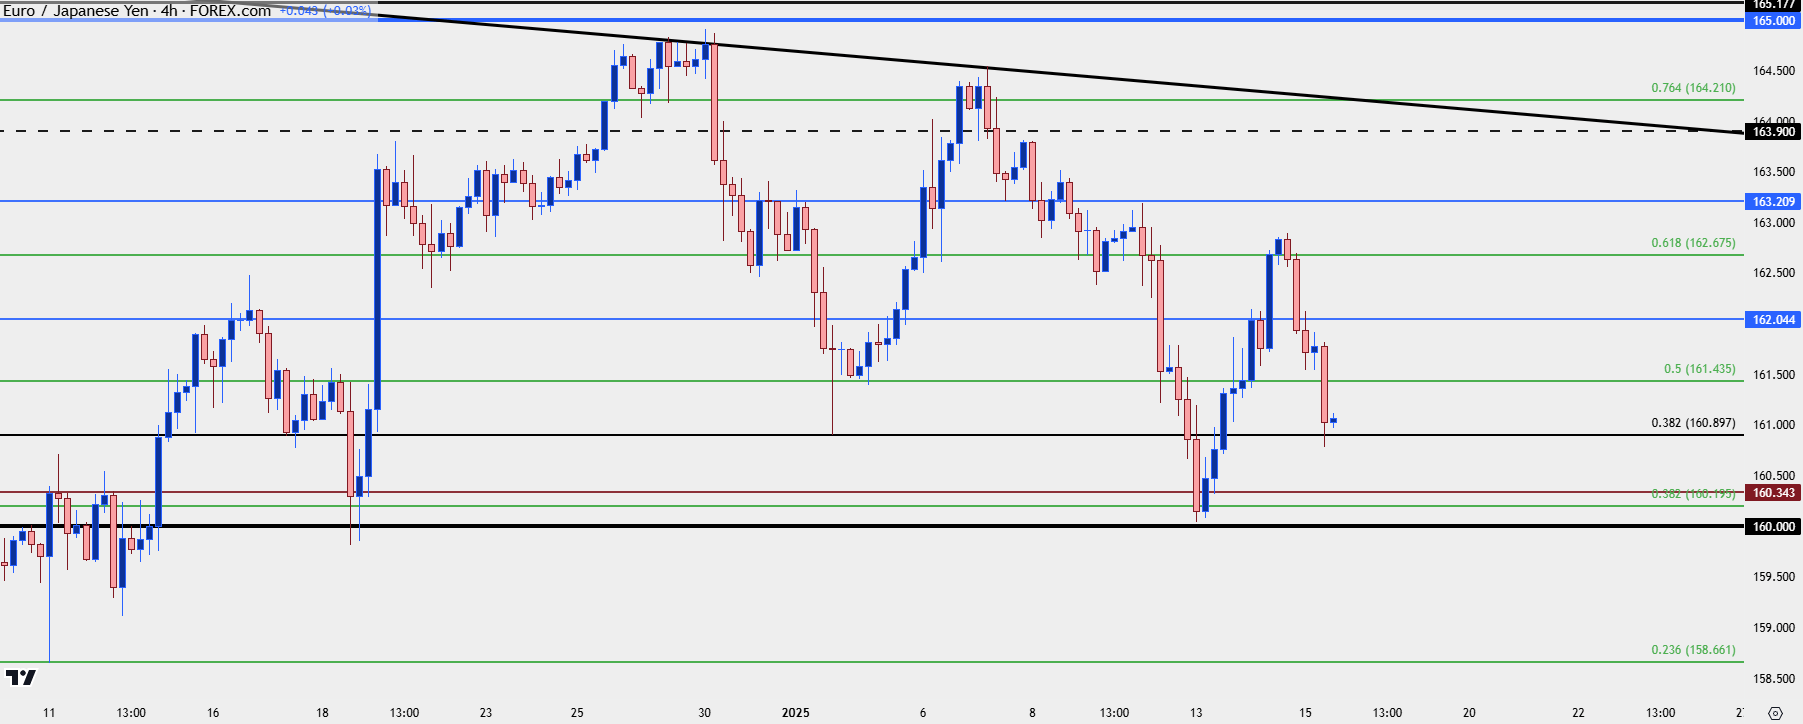 Chart prepared by James Stanley, EUR/JPY on Tradingview
--- written by James Stanley, Senior Strategist
Latest market news
September 18, 2025 02:48 PM
June 23, 2025 01:22 PM
June 23, 2025 10:39 AM
June 20, 2025 05:23 PM
June 20, 2025 04:46 PM
June 20, 2025 03:35 PM

June 20, 2025 02:18 PM

June 19, 2025 10:00 AM

June 18, 2025 04:35 PM

June 18, 2025 08:43 AM