

In the past two trading sessions, the Nasdaq index has recovered just over 2%, as market confidence has temporarily returned following the latest spike in trade war tensions, which proved to be only a short-lived scare. For now, buying pressure may become more relevant, as confidence continues to show signs of steady recovery in the short term.

Trade War Updates
At the end of last week, new comments from President Trump emerged, in which he raised the possibility of imposing 50% tariffs on the European Union, citing a lack of progress in negotiations with the region in recent weeks. This renewed threat triggered an almost immediate drop in major stock indexes, with the Nasdaq losing around 1% of its value in the last session of the week.
Shortly afterward, however, a call between the White House and the President of the European Commission resulted in an agreement to postpone the implementation of the new tariffs, originally scheduled for June 1, to July 9, giving more time for negotiations to advance. This development boosted confidence at the start of the week, and so far, the Nasdaq has managed to recover some of the ground lost due to recent trade war concerns.
Currently, short-term confidence is supported by strong performance from the index’s five largest components: Microsoft (+1.67%), Nvidia (+3.22%), Apple (+1.81%), Amazon (+1.93%), and Alphabet (+2.4%). The fact that these five major stocks are showing positive movement reflects increasing appetite for the index, a trend that could continue to fuel buying pressure.
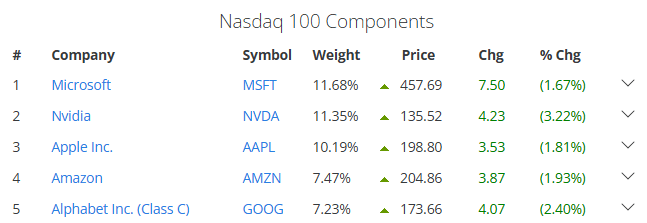
Source: Slickcharts
However, it’s important to note that the Nasdaq has shown ongoing sensitivity to trade war-related events. While current optimism has supported demand for the index, any renewed negative developments could quickly undermine that confidence and trigger sustained selling pressure in upcoming sessions.
Market Sentiment
The CNN Fear & Greed Index, which measures current market sentiment, is hovering around 66 points, placing it in the “greed” range and suggesting that short-term confidence remains steady.
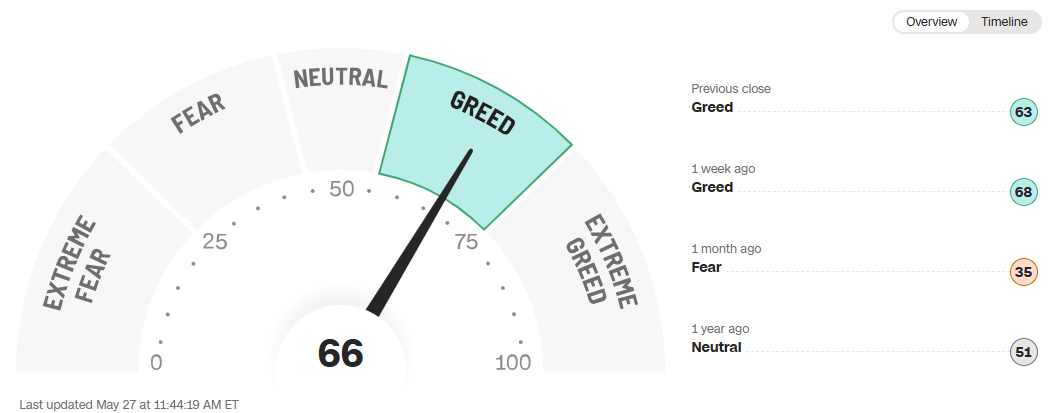
Source: CNN
In the longer term, however, the AAII Investor Sentiment Survey shows that 37.7% of investors hold a bullish outlook for the market, while 36.7% hold a bearish view over the next six months.
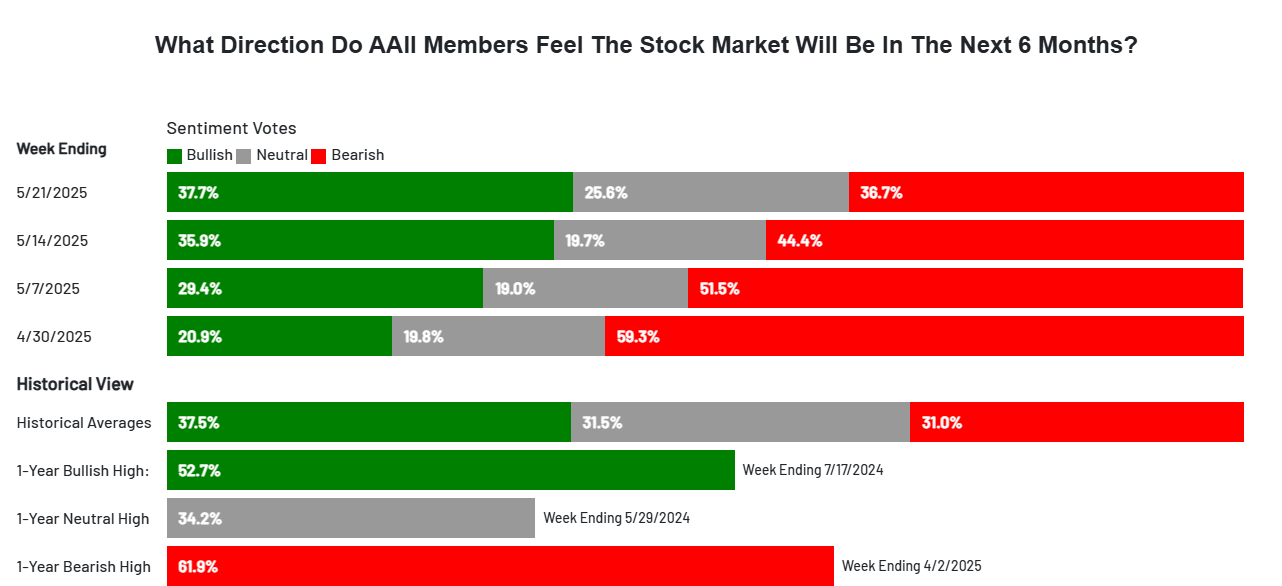
Source: AAII
This divergence between sentiment indicators highlights that while short-term optimism persists, long-term uncertainty remains. If this indecision continues, it could serve as a potential catalyst for future selling pressure on the Nasdaq 100.
Nasdaq Technical Outlook
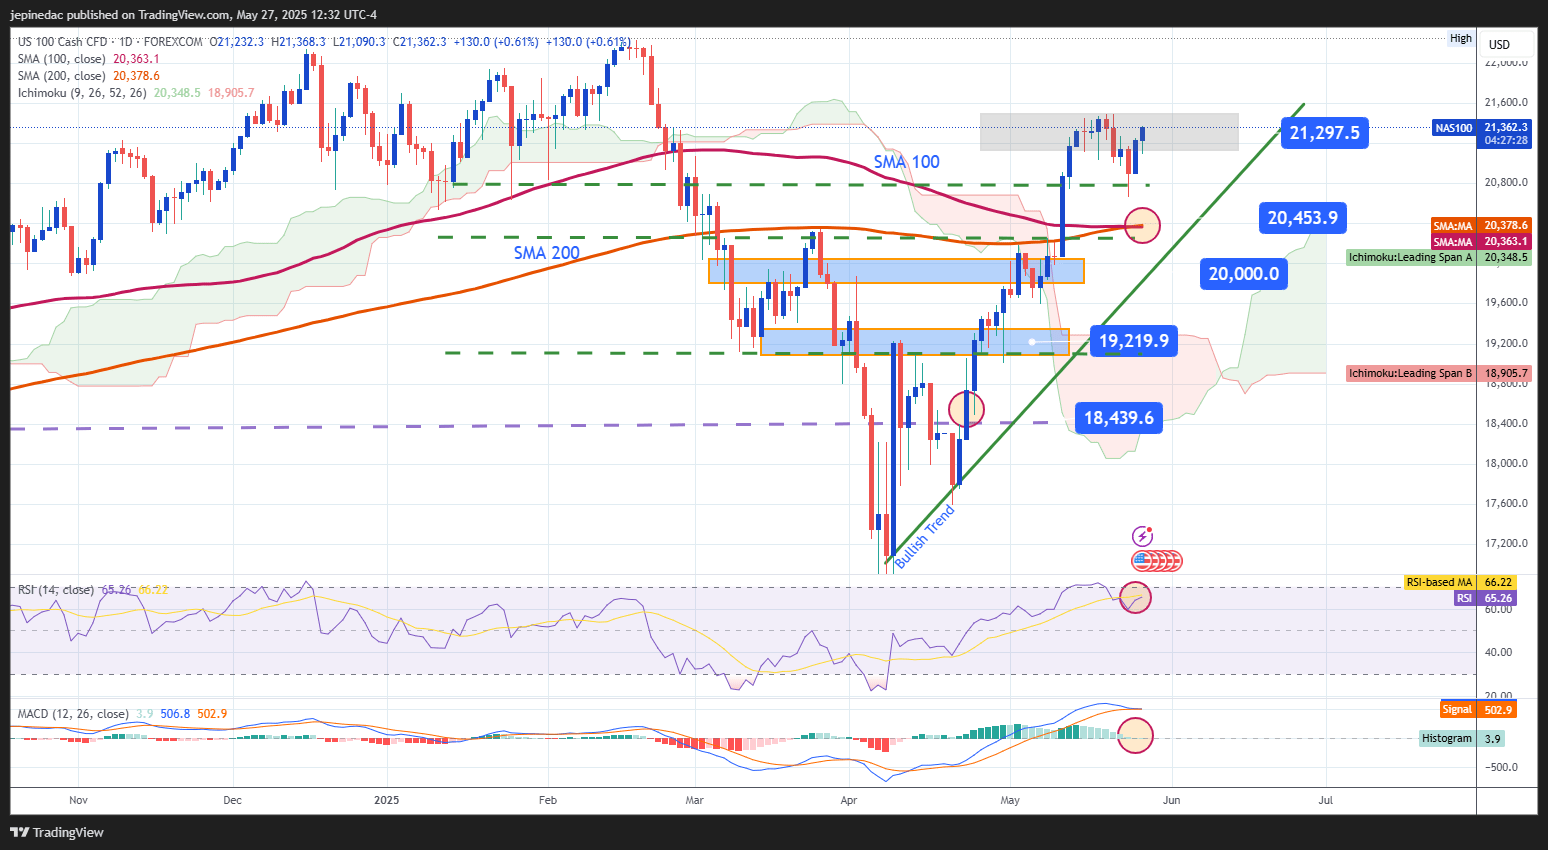
Source: StoneX, Tradingview
- Uptrend: Since early April, the Nasdaq has sustained a positive trend, once again trading above the 21,000-point threshold. However, it’s important to watch for a potential bearish crossover between the 100-period and 200-period moving averages, with the 100-period MA possibly crossing below the 200-period MA. This technical pattern could signal a slowdown in bullish momentum, indicating a potential pause in the current uptrend.
- RSI: The Relative Strength Index (RSI) remains above the neutral 50 level, supporting continued buying pressure. However, the RSI is nearing the overbought zone around 70, and if it is reached again, it could open the door for short-term pullback corrections.
- MACD: The MACD histogram is hovering near the neutral line at zero, indicating balanced momentum between the moving averages. This suggests that the index may be entering a consolidation phase in the short term.
Key Levels:
- 21,297 – Near-Term Resistance: This level aligns with a recent consolidation zone. Sustained movement above this level could reinforce the prevailing bullish outlook.
- 20,453 – Near-Term Support: This level coincides with the intersection of the 100 and 200-period simple moving averages. A drop to this zone could reflect neutral momentum in the index.
- 20,000 – Key Psychological Support: This level aligns with previous consolidation zones. A breakdown below this level could threaten the current bullish structure.
Written by Julian Pineda, CFA – Market Analyst
Follow him at: @julianpineda25
Latest market news
Yesterday 10:29 PM
Yesterday 07:25 PM

Yesterday 04:42 PM

Yesterday 07:21 AM

May 22, 2025 11:43 AM