

The Nasdaq 100 remains under important selling pressure, with losses exceeding 6% over the past five sessions. The bearish bias has intensified following the so-called “Liberation Day” led by President Donald Trump, which brought an unexpected wave of tariffs targeting multiple countries. This announcement has increased uncertainty about the U.S. economic outlook, further fueling the index’s decline.

Liberation Day Is Taking Place
Yesterday marked a turning point for financial markets, as the White House unveiled a concrete action plan in its new trade war.
Among the most notable announcements, Trump released a chart outlining new tariffs the U.S. intends to impose on dozens of countries. An initial 10% tariff on all foreign imports was established as an emergency economic and national security measure. This tariff is set to take effect next Saturday, while higher rates may be implemented starting April 9.
Additionally, the White House emphasized its intention to repatriate manufacturing, offering tax incentives to companies that produce domestically. In contrast, firms that manufacture abroad could lose tax benefits and face penalties on their imports.
These measures are already affecting U.S. markets, as they are expected to raise the cost of raw materials and imported goods, potentially creating inflationary pressures. This would translate into higher production costs and lower profit margins for companies.
The Nasdaq, made up primarily of technology companies, is particularly vulnerable. Many of these firms rely on imported components such as semiconductors, meaning higher tariffs could increase supply chain costs and hurt profits. Coupled with waning market confidence, this could continue to exert downward pressure on the index in the short term.
Currently, the Nasdaq’s Top 5 companies are all in negative territory:
- Apple, Nvidia, Amazon, and Broadcom are posting losses greater than 6%.
- Microsoft shows a more moderate decline, around 3%.
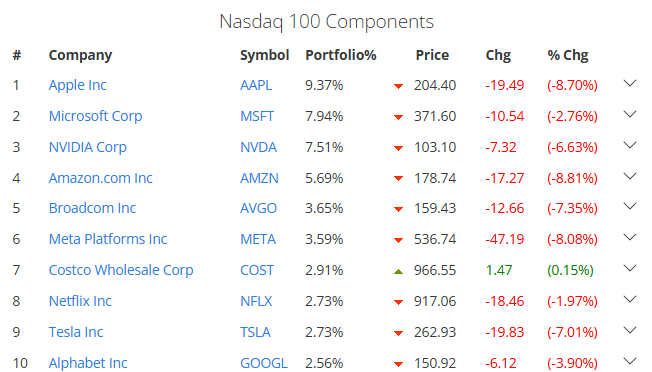
Source: slickcharts
The market sees the new tariffs as a direct blow to the tech sector. Many companies rely on international production of key components, and higher tariffs could make final products more expensive, reducing consumer demand and growth expectations. In the short term, this could continue to fuel selling pressure on the Nasdaq.
What About Confidence?
CNN’s Fear & Greed Index is currently showing values near or below 10, which represents “extreme fear”—its lowest level in years. Exactly one year ago, the index stood at 69 (greed zone), highlighting how investor sentiment has drastically shifted into persistent fear.
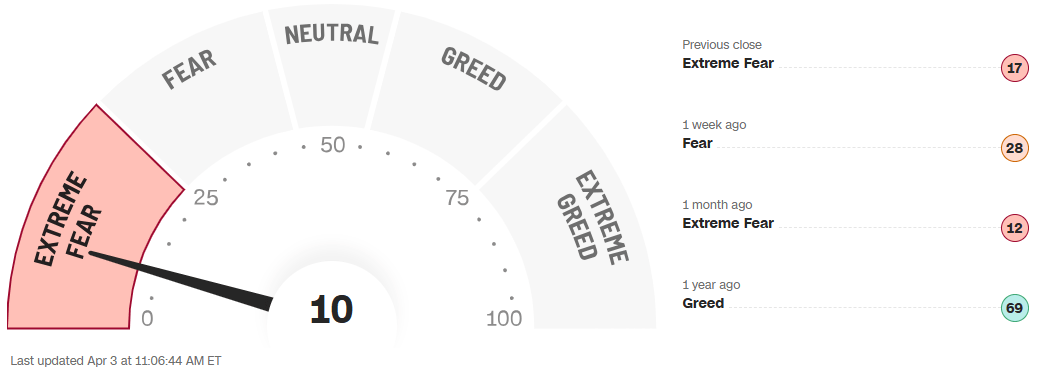
Source: CNN
This erosion in confidence has triggered a flight to safety, with capital moving into Treasury bonds, while risk assets, such as Nasdaq tech stocks, have been among the hardest hit. As non-essential goods, these stocks are highly sensitive to economic sentiment. If distrust persists, selling pressure may continue to weigh on the Nasdaq 100 in the sessions ahead.
Technical Outlook for the Nasdaq
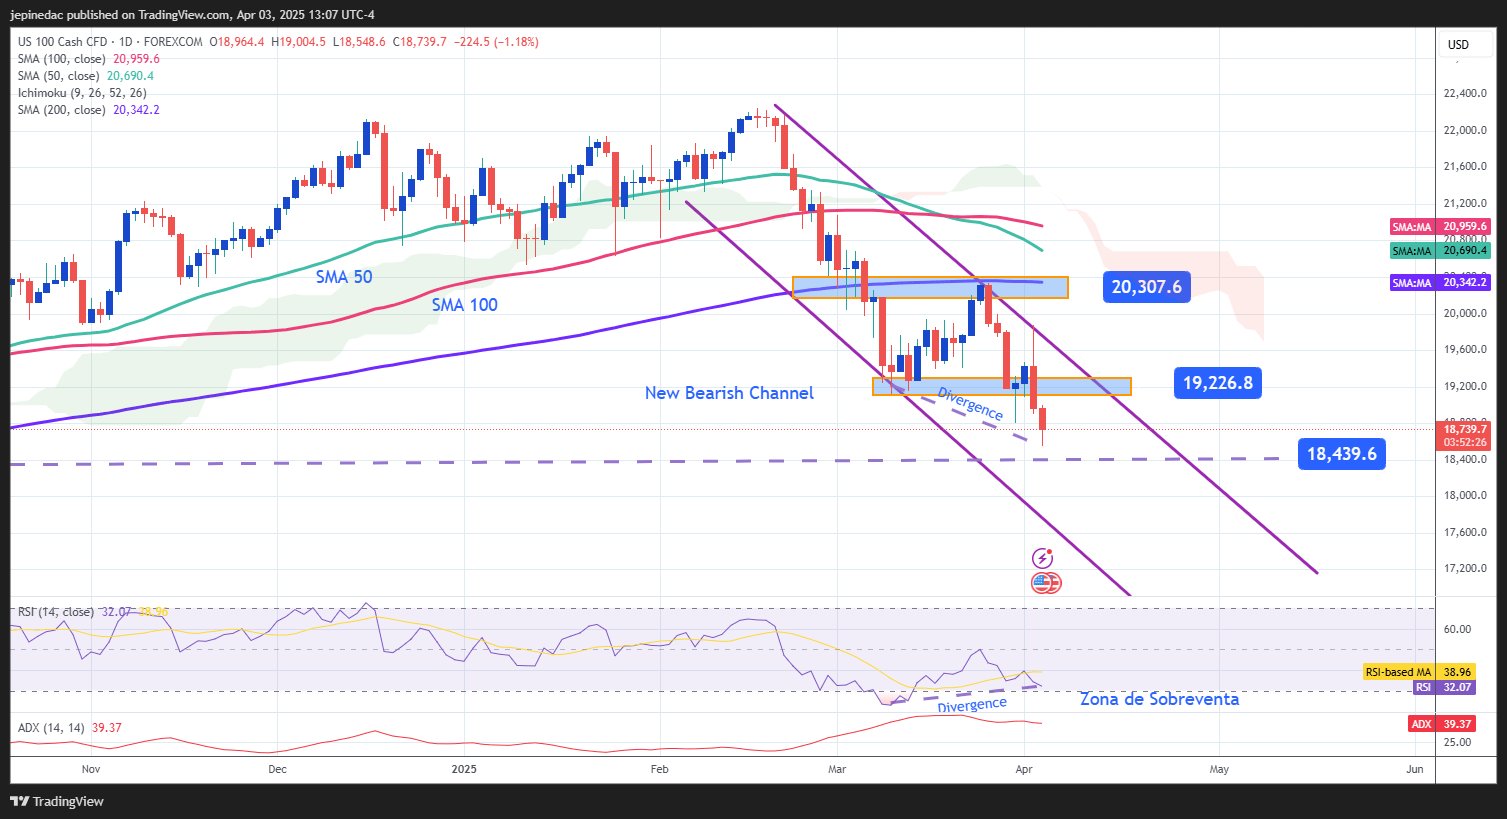
Source: StoneX, Tradingview
- Bearish Channel: Since mid-February, the index has formed a clear descending channel, driven by sustained selling pressure that has pushed prices to new lows. This technical pattern has become the dominant short-term formation.
- Moving Averages: The 50-period moving average has remained below the 100-period moving average, reinforcing the current bearish momentum. As long as both moving averages continue trending downward, this could be a key signal that selling pressure may intensify.
- ADX: The ADX line remains above the neutral 20 level, indicating that current downward movements have strong trend strength. As long as the ADX stays at these levels, the bearish trend is likely to continue.
- RSI: The RSI is also providing key signals: the indicator has approached the oversold level (30), and a bullish divergence has formed, with lower lows in price and higher lows in the RSI. This suggests a market imbalance that could open the door for short-term bullish corrections.
Key Levels:
- 20,300 pts – Key resistance: This level aligns with the 200-period moving average. A return to this level could revive buying sentiment and challenge the current bearish formation.
- 19,200 pts – Intermediate resistance: A neutral zone seen in recent weeks. This may be the area where short-term bullish corrections could occur.
- 18,400 pts – Critical support: This level marks a new low not seen since September 2024. A breakdown could confirm a deeper bearish channel.
- 20,300 pts – Key resistance: This level aligns with the 200-period moving average. A return to this level could revive buying sentiment and challenge the current bearish formation.
Written by Julian Pineda, CFA – Market Analyst
Latest market news
Yesterday 05:00 PM
Yesterday 04:00 PM
Yesterday 03:11 PM

Yesterday 01:35 PM

May 8, 2025 12:20 PM

May 7, 2025 01:07 PM

May 5, 2025 05:19 PM