

Are dip-buyers back or is this the calm before the (resumption of) storm? Indices, metals, oil, FX majors and cryptocurrencies have all bounced back after Wall Street slumped Monday on fears over Trump's trade war. In this Nasdaq 100 technical analysis article, we will examine whether this is merely an oversold bounce or something more significant, highlight key levels to watch and discuss some potential trade ideas.
Welcome to another edition of Technical Tuesday, a weekly report where we highlight some of the most interesting markets that will hopefully appease technical analysts and traders alike. In this edition, we will get technical on the Nasdaq 100.

Nasdaq 100 Technical Analysis: Oversold Bounce or Trend Reversal?
One thing that has been quite clear all these years in this long-term bull market is that every time we have had a decent sell-off, dip-buyers have invariably stepped in and drove markets to new highs despite any macro concerns. Every single time we have heard cries of “this time it is different,” the bulls have prevailed, and bought the dip. Not even covid could hold the bulls back, let alone the unwinding of yen carry trades in 2024, or China’s sluggish recovery that caused local markets to tank last year, and before that the Russian invasion of Ukraine, or the bear market of 2022 when inflation surged and caused interest rates to shoot higher across the world (excluding Japan). Are we going to see yet another such recovery soon, or does the market want to go a little deeper before dip buyers emerge? That’s the key question, and one way to find clues is by looking at the charts. We already know why markets have slumped this time, namely trade war concerns, so let’s not regurgitate that.
Key Resistance and Support Levels to Watch
Regular readers might recall that I had been banging on about valuation concerns and technically overbought conditions before markets topped out in February. But this double-digit percentage drop in the Nasdaq 100 means both of those factors are now less of a concern. In fact, the Relative Strength Index (RSI) has not been this oversold at 25 since the bear market of 2022, when it plunged to 22 in January of that year. On a side note, the RSI was not at its extremist oversold levels when markets eventually bottomed then in October of that year. By the way, there is a lesson in this – i.e., even if we do see an oversold bounce here, this may not necessarily turn out to be THE bottom, which could take – as we saw in 2022 – months to form. And that’s not necessarily what I am looking for this time (a bear trend lasting months), but it is something that cannot be ruled out at this stage.
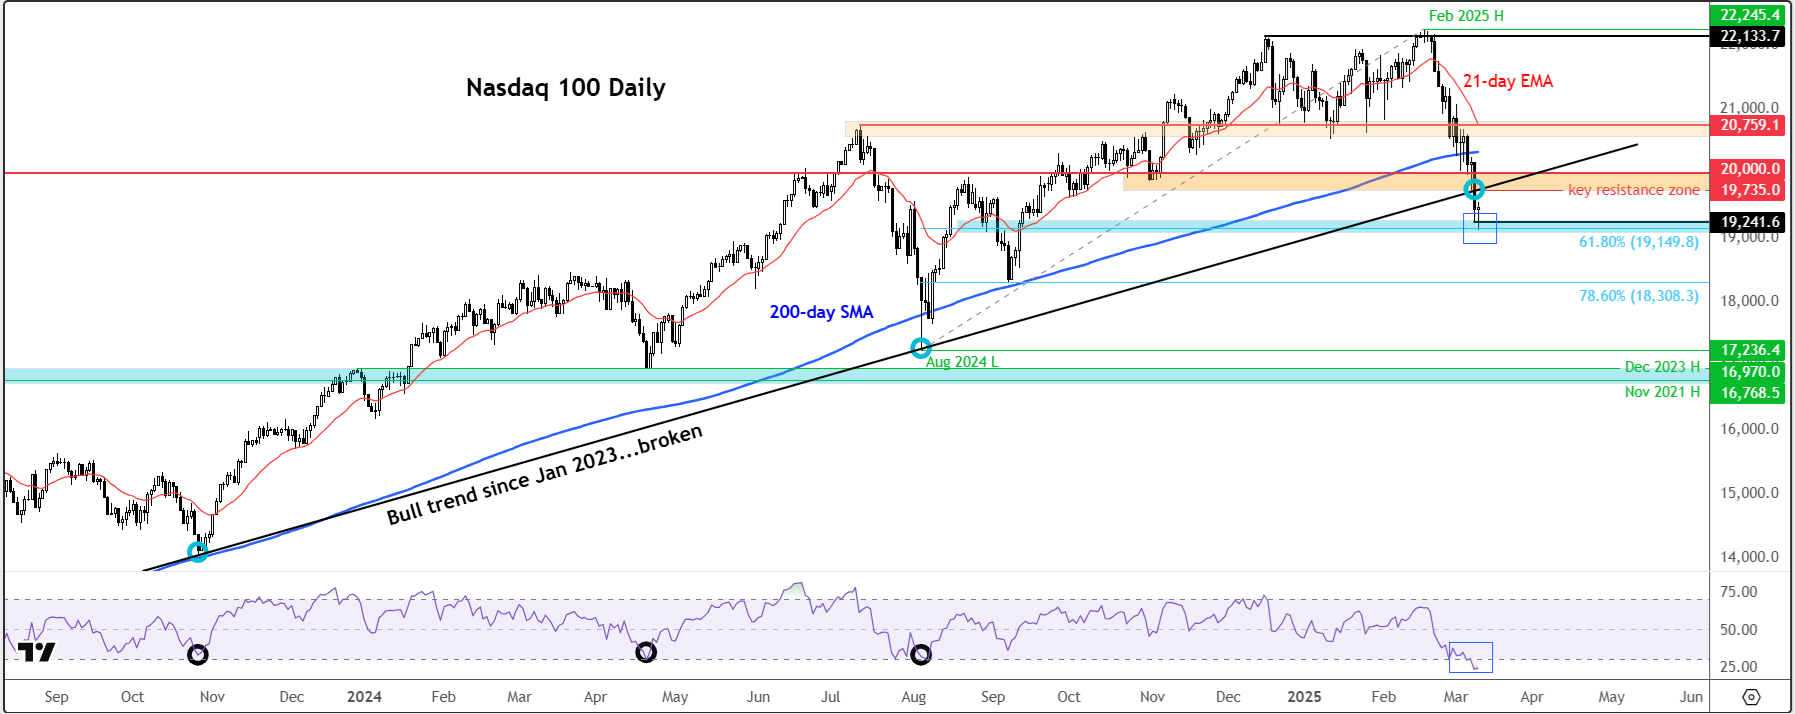
Source: TradingView.com
Anyway, as the chart shows, whenever the RSI has crossed below the 30 oversold threshold, we have invariably seen a bounce – and sometimes a major low. Thus, as a minimum, an oversold bounce to the nearest resistance is what I am looking for here. The nearest resistance is located at 19735, marking the low from Friday and the backside of the broken trend line that had been in place since January 2023. In fact, this level is the lower end of the key resistance range stretching to 20,000 level (shaded in orange colour on the chart).
They key support area to watch is around the 19,000-19,240 area. The lower end is the next psychologically-important level, while the middle i.e., 19150 level, marks the 61.8% Fibonacci retracement against the August-February rally, and the upper end marks the low from yesterday. We have already seen the index bounce from this zone, but a daily close above it would create a hammer-like candle, which could turn out to be significant. That being said, similar hammer looking candles, for example on Friday, and a few other ones during this correction, have failed to show bullish follow-through.
Will Dip Buyers Prevail Again?
So, if we do see a bounce into the close today, the key thing to then monitor is whether there will be any further upside follow-through, which has been missing every time we have seen recovery attempts during this correction phase. The key objective for the bulls will be to reclaim the broken trend line and thus move back above that 19735 level, and ideally 20,000, by the close of play today, or at a later point in time this week.
But until we see clear evidence of a bottom, traders must remain nimble and take things from one level to the next. Studying the charts and doing Nasdaq 100 technical analysis is always important if you trade the index, futures, ETFs or invest in induvial socks, but never ignore the fundamentals.
-- Written by Fawad Razaqzada, Market Analyst
Follow Fawad on Twitter @Trader_F_R