

NZD/USD Summary
The New Zealand economy may have started 2025 with a bang, but that wasn’t enough to support the Kiwi dollar on Thursday with the pair sinking to multi-week lows as risk aversion returned. Having taken out some key downside levels, there’s scope for the move to extend further—especially if risk appetite were to sour.
Strong Growth is Yesterday’s News
New Zealand’s economy grew 0.8% in Q1, comfortably ahead of the RBNZ’s 0.4% forecast, with strength concentrated in goods production. Despite the quarterly pop, annual GDP was still down 1.1%, a reminder that broader conditions remain fragile.
Manufacturing rebounded 2.4%, helped by transport equipment and machinery, while business services also rose 2.4% thanks to a lift in IT-related activity. Healthcare chipped in with another solid quarter, up 1.4%. The bounce in goods-producing industries—up 1.3% after a sharp fall in Q4—was a key driver behind the upside surprise. The services side—the largest sector accounting for 73.6% of GDP—was softer, rising 0.4% overall.
Despite topping market and RBNZ expectations, the data was rightly treated by traders as something akin to a historic document with little relevance to today.

NZD/USD Breaks Down
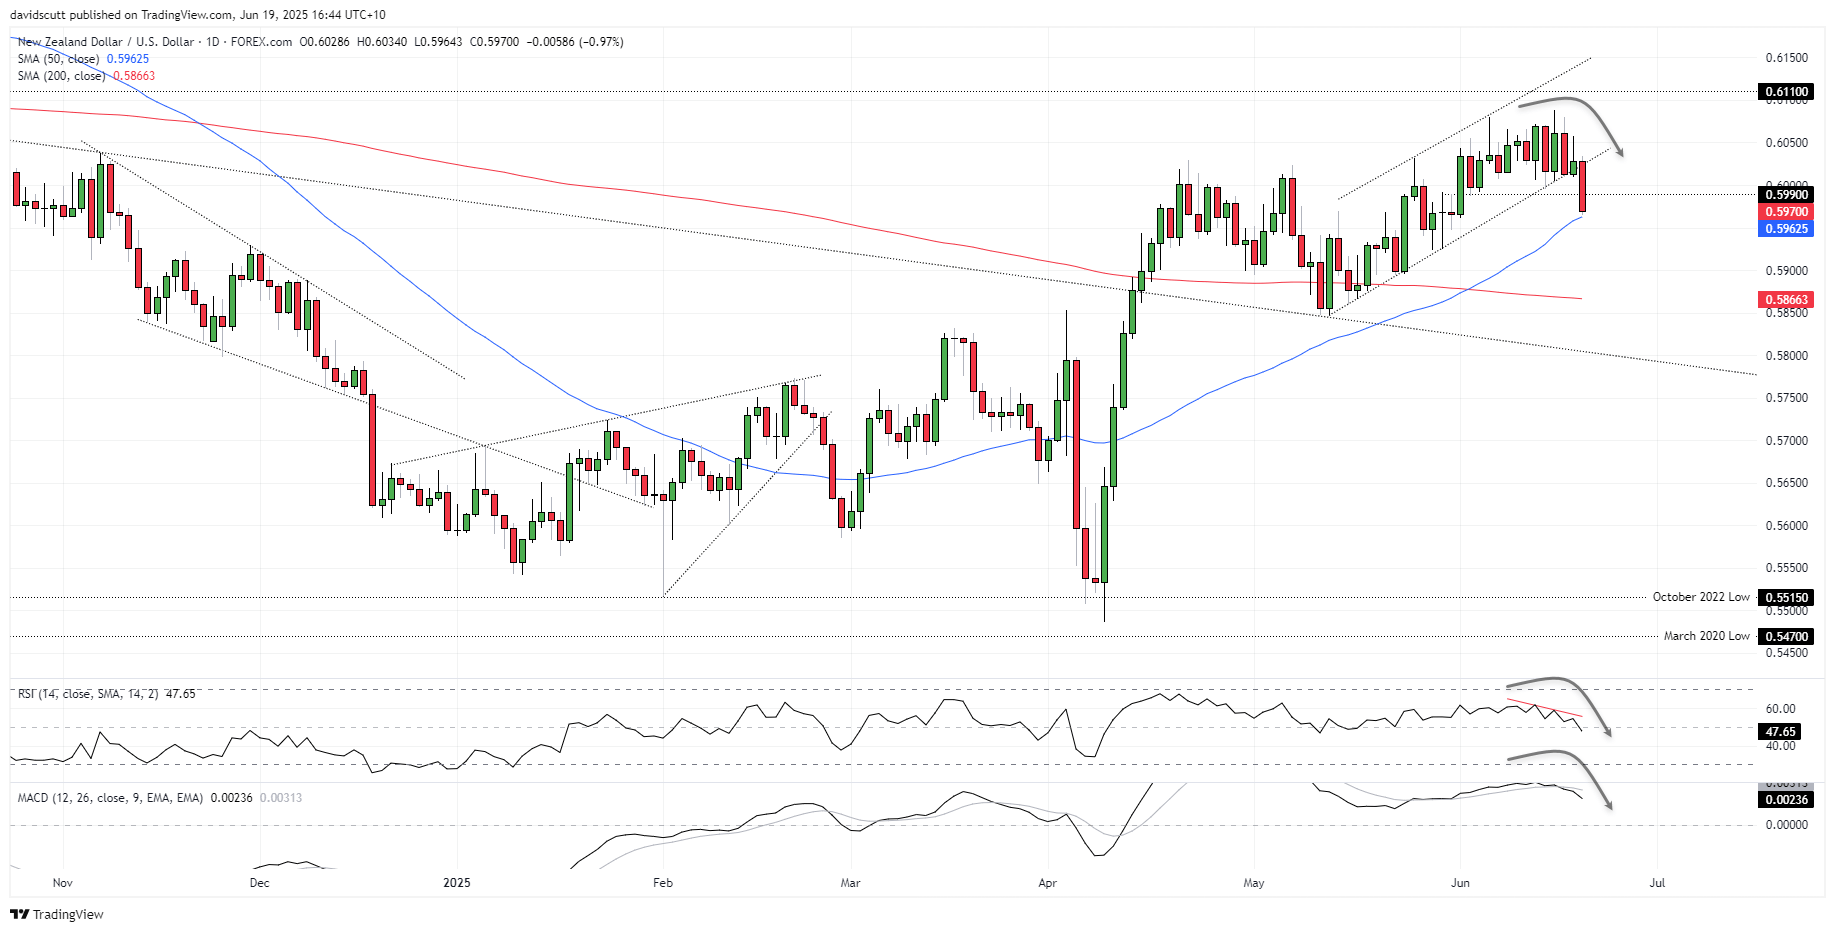
Source: TradingView
Downside risks for NZD/USD flagged earlier in the week have materialised, with the price tumbling to levels not seen since early June. Rather than being Kiwi-specific, the move was sparked by a Bloomberg headline stating the U.S. was readying for a possible attack on Iran in the “coming days.” It was enough to see NZD/USD break channel support it had been testing for several days beforehand, overwhelming buyers who had been lurking beneath .6000.
RSI (14) is trending lower and below 50. MACD remains above zero but has already crossed the signal line and is keeling over, adding to the sense that while not yet outright bearish, the momentum picture is shifting in that direction.
Downside levels to watch include the 50-day moving average, .5925—where the Kiwi bounced from in late May—along with .5900 and the important 200-day moving average. Having previously acted as support, .5990 may now revert to resistance if the bearish break were to reverse.
-- Written by David Scutt
Follow David on Twitter @scutty
Latest market news
September 18, 2025 02:48 PM
June 23, 2025 01:22 PM
June 23, 2025 10:39 AM
June 20, 2025 05:23 PM
June 20, 2025 04:46 PM
June 20, 2025 03:35 PM

June 20, 2025 05:23 PM

June 20, 2025 05:20 AM

June 20, 2025 12:39 AM
June 19, 2025 11:09 PM