
- Morning star pattern playing out with upside follow-through
- Price above trendline resistance from December
- Momentum indicators swinging in bulls’ favour
- Strong correlation with gold hints at temporary haven appeal
Summary
NZD/USD is breaking out, supported by a textbook morning star pattern and improving momentum signals. Interestingly, the Kiwi has also shown an unusually strong positive correlation with gold in recent weeks, hinting it may be catching some haven flows.
NZD/USD Breakout May Have Legs
The three-candle morning star pattern completed on the NZD/USD daily chart last week turned out to be one of the more reliable signals for FX traders to act upon, with the price subsequently surging back above the important 50-day moving average before taking out the year-to-date highs set just before the U.S. liberation day tariff announcement in early April.
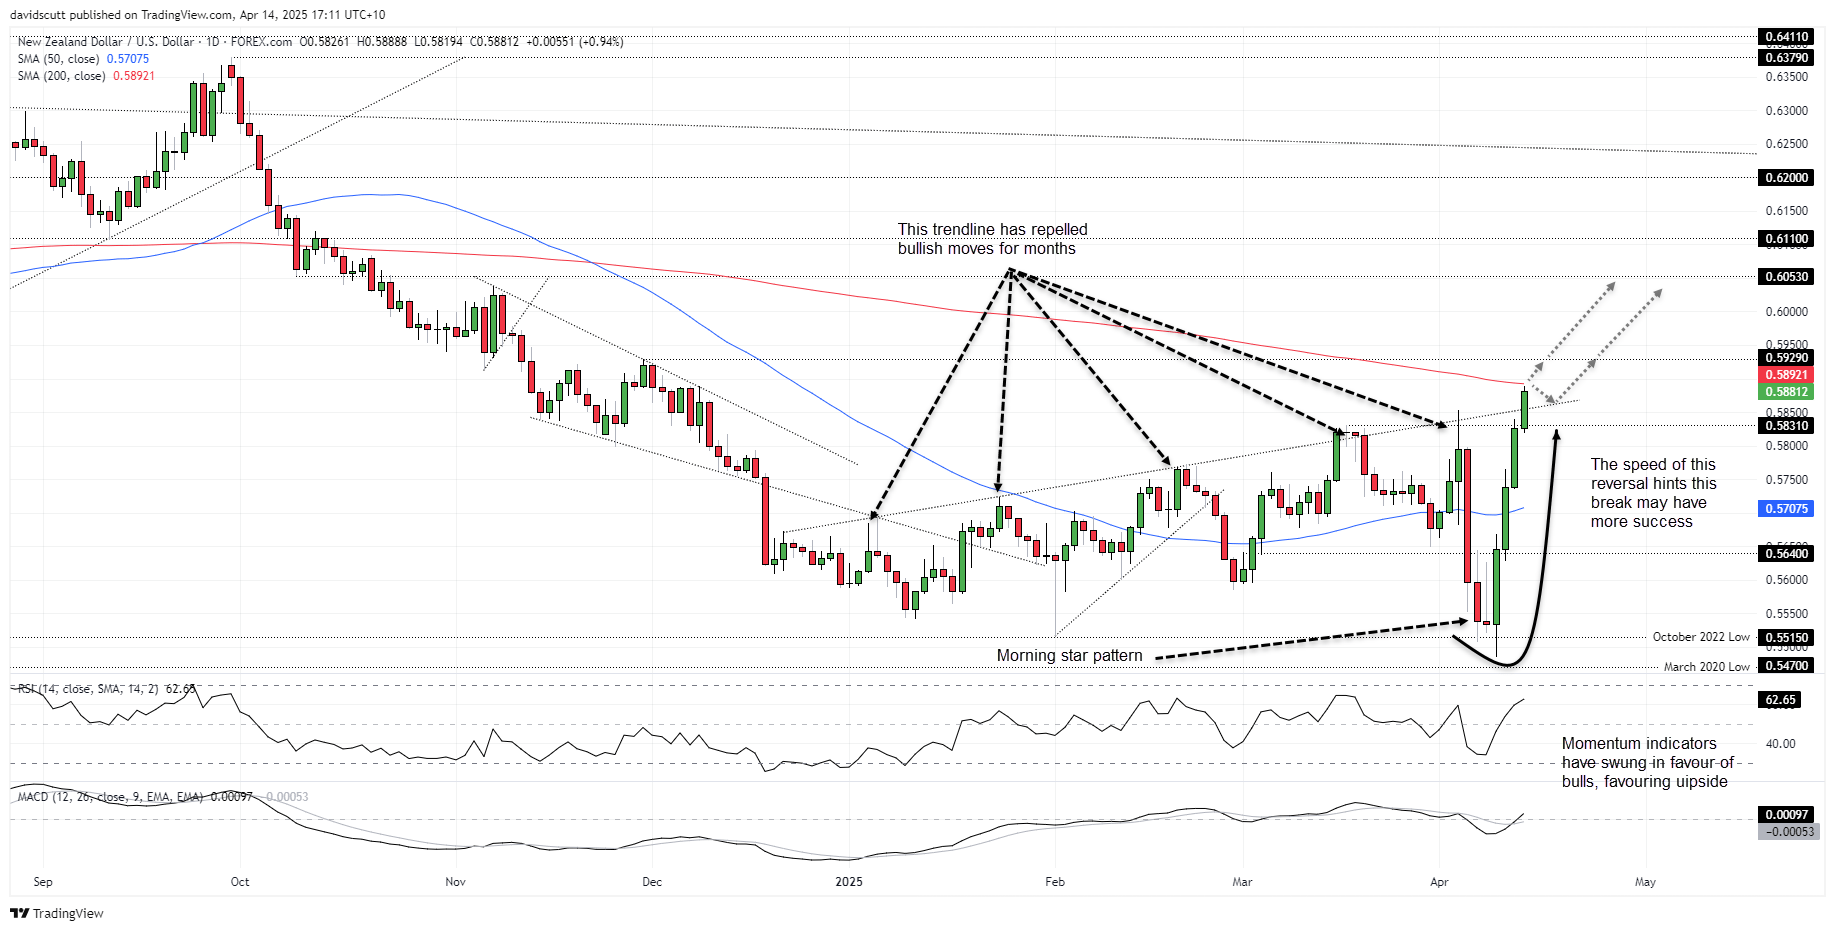
Source: TradingView
Near-term price action may continue to be instructive on medium-term directional risks for the Kiwi, with the price now trading above uptrend resistance dating back to December last year. The trendline has capped numerous bullish moves since being established in January, meaning a convincing break above it on Monday may encourage others to join in the bullish move.
Such a move would generate a bullish setup, especially if the move can extend meaningfully unlike in March when the Kiwi struggled to find traction despite breaking and closing above it on two consecutive days. This push looks far more convincing given the speed at which it’s occurred. Momentum indicators are also swinging in favour of the bulls with RSI (14) trending higher without being overbought while MACD has crossed over from above and sits in positive territory, providing an overall signal that favours buying dips over selling rips.

NZD/USD Trade Ideas
Those considering long setups could initiate positions above the trendline with a stop beneath for protection. The preference would be to see the price retest the trendline before bouncing, but it should not be regarded as a dealbreaker. Another option would be to wait to see how the price interacts with the 200-day moving average found at .5892. If it were to be breached, longs could be established above it with a stop beneath it or the uptrend for protection.
Potential topside targets include the November 2024 swing high of .5929, .6053, or .6110, depending on your desired risk-reward.
Though it’s hard to classify the Kiwi as being a safe haven considering where it sits on the charts against a variety of major developed market currencies, it’s interesting to note that NZD/USD has been unusually correlated with the gold price over the past fortnight on a daily timeframe, sitting with a correlation coefficient of 0.95—that’s nearly perfect.
The Kiwi’s relationship with bullion has been far stronger than currencies of major gold producing nations such as the Australian dollar over this period, hinting it may be a temporary benefactor of haven flows out of the U.S. dollar.
-- Written by David Scutt
Follow David on Twitter @scutty
Latest market news
Yesterday 11:53 PM
Yesterday 09:49 AM
Yesterday 08:00 AM
May 3, 2025 08:00 PM


Yesterday 11:53 PM

May 3, 2025 08:00 AM

May 2, 2025 02:57 AM