

The WTI crude oil barrel has shown a steady variation of barely 2% over the past two weeks of trading, settling around the $60 per barrel zone. Currently, indecision persists as factors such as comments from OPEC+ regarding a possible production increase and ongoing demand uncertainty keep the price in a neutral bias in the short term. As the market digests the new OPEC+ statements, clear catalysts could emerge to break the current indecision phase.

What Path Will OPEC+ Follow?
As May approaches, so does the upcoming OPEC+ meeting, scheduled for May 5, where at least eight member countries will discuss the future of oil production. It is important to note that in previous comments, the organization expressed its intention to progressively increase production by 2.2 million barrels per day, starting in June, with monthly increases that could extend through 2026.
Among the reasons for pursuing this plan are healthy market fundamentals and a positive outlook for the oil industry, which would justify raising production after the long pause in recent years.
Additionally, it is worth noting that the President of Ukraine recently expressed optimism about a potential peace agreement with Russia, facilitated by the mediation of the United States. If realized, this scenario could lead to the lifting of several sanctions on Russia, contributing further to the expected increase in global oil supply, alongside the OPEC+ initiatives.
The potential production increase stemming from these factors could boost the overall availability of oil barrels worldwide, thereby exerting downward pressure on WTI prices in the short term. If the trend toward higher production continues over the coming months, selling pressure could become a determining factor in the evolution of oil prices throughout 2025.
Demand Behavior
Currently, a temporary confidence sentiment persists around the U.S.-China trade war, following recent comments by President Trump advocating for a diplomatic resolution, which could lead to a reduction of the 145% tariff still in place. However, no clear agreement has yet been reached that would fully eliminate the trade war’s impact on short-term oil demand outlooks. This lingering uncertainty could continue to weigh negatively on demand expectations and sustain bearish pressure on oil prices.
In the latest monthly oil market report published by the International Energy Agency (IEA), the forecast for global demand growth was cut from 1.03 million barrels per day to 730,000 barrels per day for this year. This downward revision reflects a lower expected increase in demand amid persistent risks of a commercial escalation.
In this context, demand growth expectations remain weaker than the projected increases in global supply, tilting the balance toward a scenario of oil oversupply. If these factors persist, weakness in WTI movements could develop over the coming weeks.
WTI Technical Outlook
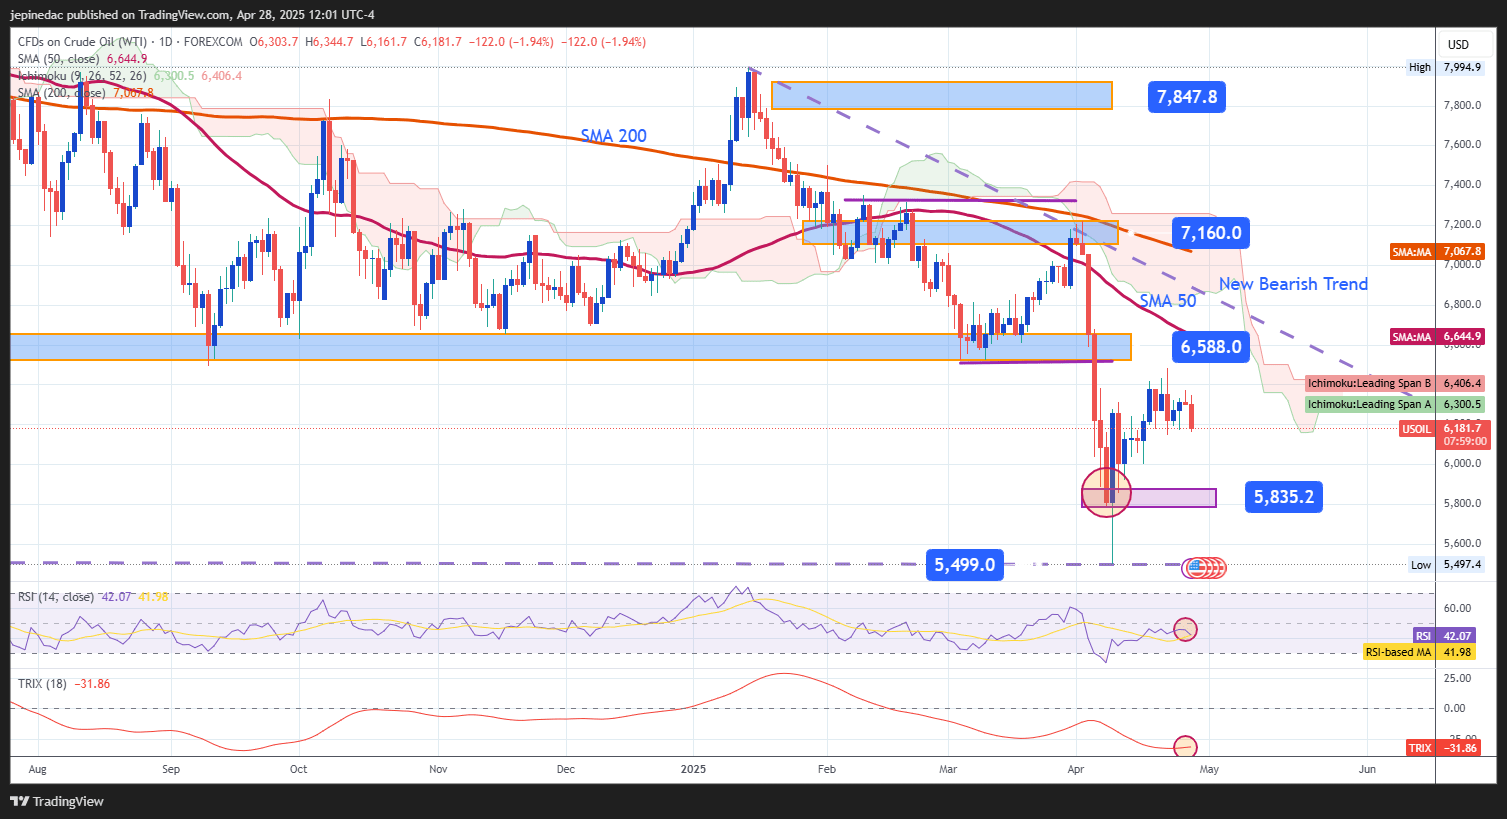
Source: StoneX, Tradingview
- Downtrend Continues: Since January 15 of this year, a consistent downtrend has formed in oil price movements. Recent bullish oscillations have failed to reach the resistance zone around $66 per barrel, reinforcing the dominance of selling pressure and consolidating the downtrend as the most relevant technical pattern in the short term.
- RSI: The RSI line continues to show a predominance of bearish momentum, remaining below the neutral 50 level. This suggests that the average oscillations over the past 14 sessions continue to point downward, and as long as the RSI stays below neutral, the bearish momentum is likely to persist in the short term.
- TRIX: The TRIX indicator remains consistently below the zero line, indicating that the moving averages maintain a bearish bias in the short term. Moreover, the TRIX is currently at levels not seen since October of last year, reinforcing the ongoing selling pressure. As long as the TRIX remains at these low levels, bearish dominance could continue in upcoming sessions.
Key Levels:
- $58 – Critical Support: A minimum level that coincides with neutral zones not seen since 2019. A breakdown below this support could trigger a deeper bearish trend in the short term.
- $66 – Nearby Resistance: This corresponds to the former consolidation zone of the lateral channel and aligns with the 50-period simple moving average. It could act as a barrier to short-term bullish corrections.
- $71 – Relevant Resistance: This level coincides with the 200-period simple moving average. If the price approaches this area, it could threaten the current downtrend structure and allow for a potential shift in market bias.
Written by Julian Pineda, CFA – Market Analyst
Follow him at: @julianpineda25
Latest market news
June 23, 2025 01:22 PM
June 23, 2025 10:39 AM
June 20, 2025 05:23 PM
June 20, 2025 04:46 PM
June 20, 2025 03:35 PM
June 20, 2025 02:18 PM

June 20, 2025 05:20 AM
June 20, 2025 04:38 AM

June 20, 2025 12:39 AM

June 19, 2025 11:09 PM