

Key Market Events
- Bearish sentiment persists: Rising inventories, oversupply risks, and fears of economic contraction continue to weigh on oil prices. Short-lived geopolitical impact: The positive effects of sanctions and geopolitical tensions remain temporary, with oil prices respecting a key support zone established since December 2021
- Central bank policies in focus: Amid an uncertain economic outlook driven by tariff risks, central banks are maintaining their current rate stance
- The upcoming FOMC meeting is expected to clarify whether the outlook is dovish or hawkish, influencing both economic expectations and oil demand
Oil's recent decline aligns with a broader three-year downtrend. The ongoing debate over renewable energy adoption, OPEC’s plans to unwind supply cuts, Trump’s pro-drilling policies, and weaker demand projections due to trade war concerns reinforce a bearish sentiment across the market.
While recent price gains have been driven by geopolitical tensions and sanctions, these gains have proven unsustainable. A sustained recovery in oil prices would likely require a significant catalyst, such as trade agreements, economic stimulus measures, and improving global growth forecasts.
China continues to implement stimulus measures through the housing sector, domestic consumption, and monetary policies, as deflation concerns pose a threat to overall oil demand. Strengthening economic indicators from China will be crucial in boosting market sentiment for oil. Meanwhile, global central banks are increasingly inclined toward maintaining interest rates or implementing potential rate cuts to shield their economies from the adverse effects of trade war-induced slowdowns.
Technical Analysis: Navigating Key Levels
Oil prices remain largely range-bound, as the interplay between sanctions, peace agreements, government stimulus measures, and oversupply risks keeps the market fluctuating near a critical four-year support zone between $64 and $66. This zone represents the 50% Fibonacci retracement level of the uptrend from 2020 to 2022, during which oil prices rebounded from below $0 to above $120 per barrel.
A decisive break below the $63.80 mark could trigger further declines, aligning with the 0.618 Fibonacci level and testing the psychological $60 level. Should bearish momentum persist, oil could extend losses toward $55 per barrel.
OPEC members may face pressure from declining oil prices; however, key producers, particularly in the UAE, are actively diversifying their economies to reduce reliance on oil revenue. Notably, the UAE MSCI Index remains near its 2022 highs, despite the continued downward trajectory of oil prices since that time.
Markets remain in a holding pattern, awaiting a potential shift from trade wars to trade deals, as well as further clarity from the Federal Reserve on its economic outlook and monetary policy direction.
Crude Oil Technical Forecast: Daily Time Frame (Log Scale)
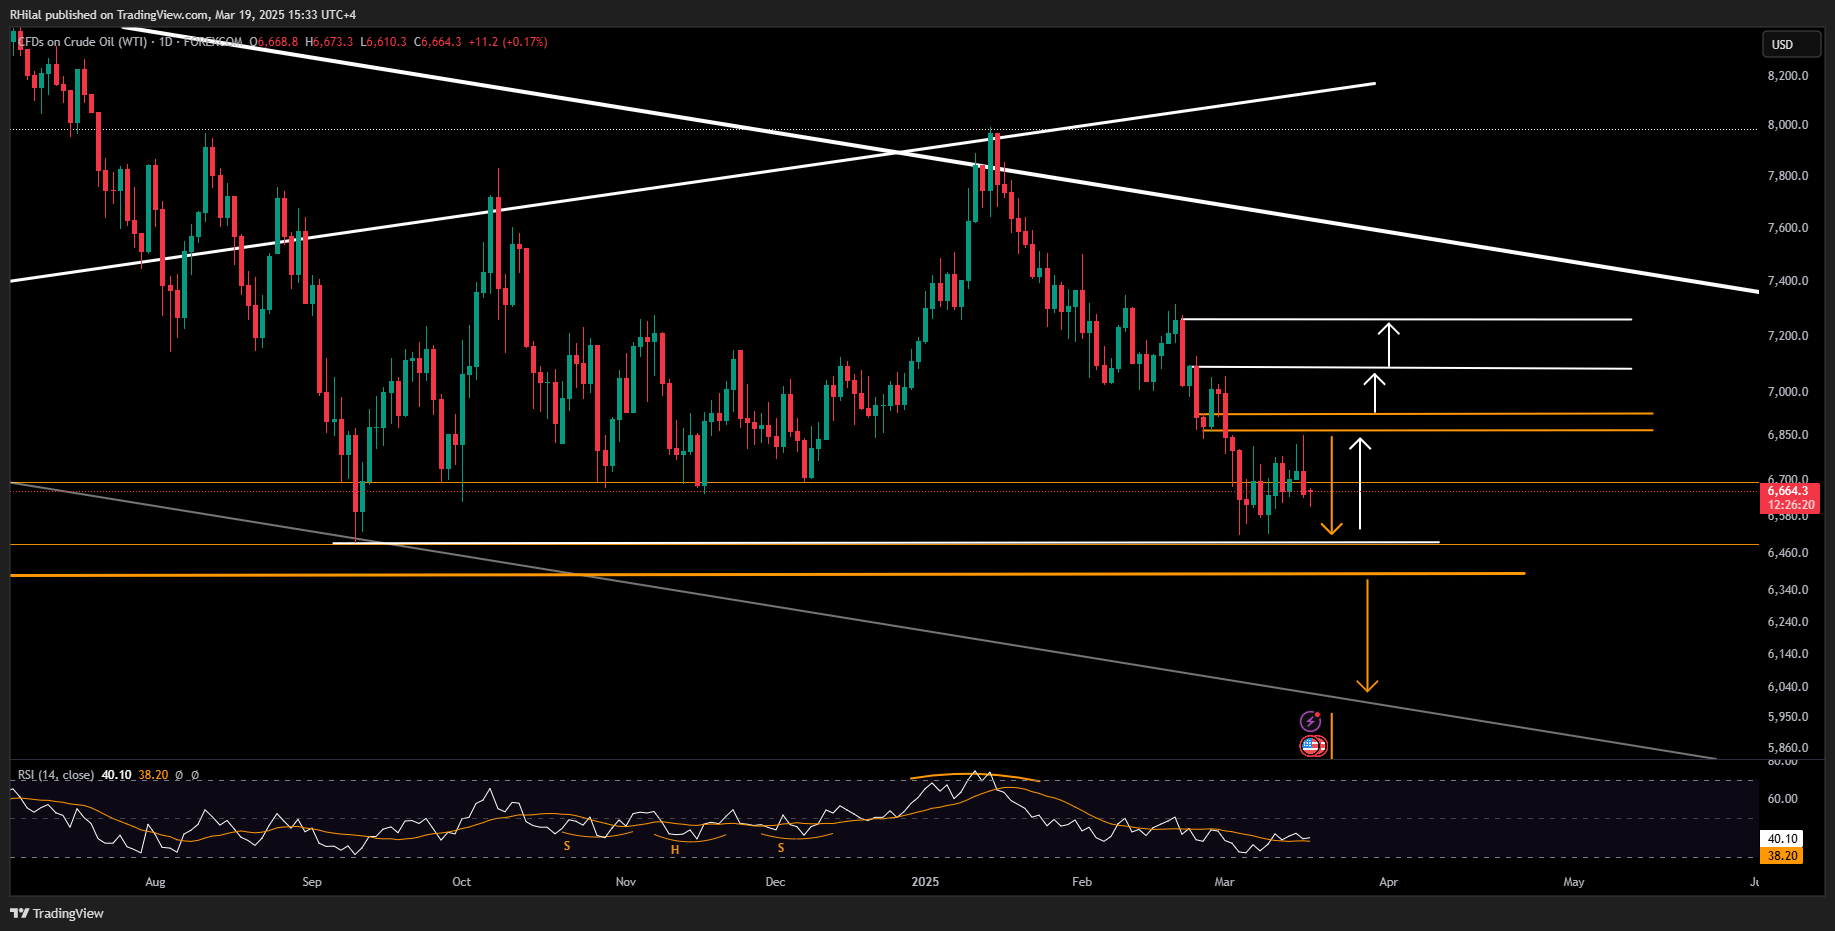
(Source: TradingView)
Following an initial rebound from the $65 support zone, oil retraced near the 0.236 Fibonacci retracement level of the downtrend from January to March 2025 at $68.50. If oil sustains gains above $68.70 and $69.20, upside momentum could push prices toward $70.80, $72.60, and $74.30.
Conversely, should oil break below the $64-$66 support zone, a sustained move beneath $63.80 may lead to further declines, aligning with the 0.618 Fibonacci retracement level and testing psychological thresholds at $60 and $55 per barrel.
Written by Razan Hilal, CMT
Follow on X: @Rh_waves
Latest market news

April 24, 2025 11:29 AM

April 24, 2025 02:23 AM

April 20, 2025 01:00 PM