

- S&P 500 forecast: Stocks rise as Trump call with Xi resulted in a “very positive” conclusion for both countries, according to the US president
- Commodity currencies firmer as US and China agree to start a new round of trade talks; USD/JPY rebounds and gold turns negative despite big silver breakout
- Lagarde says ECB are getting towards the end of the easing cycle, sending EUR/USD near 1.1500
After a small wobble shortly after the open as traders took profit, markets were trying to bounce back as details of the call between Trump and Xi started to emerge. The overall tone was positive, supporting the recent optimism that trade talks will resume between the world’s two largest economies. This kept commodity dollars supported while the USD/JPY bounced back from beneath 143.00 as investors priced out risks of further disruptions in US-China trade talks. Meanwhile, the euro shot higher on the back of a hawkish ECB press conference where Christina Lagarde warned that the central bank is getting closer to the end of the easing cycle. The DAX, which earlier hit a new record, came sharply off its highs, but was still in the positive amid the overall positive risk tone. In the US, some investors were opting to keep their powder dry ahead of Friday’s all-important US non-farm payrolls report. Overnight, in Japan, long-dated government bonds rallied following a stronger-than-feared 30-year debt auction, providing some welcome calm after recent volatility in the bond market. Our S&P 500 forecast remains positive.
Trump-Xi call details emerging
Yesterday, Trump called Xi “extremely hard to make a deal with,” while simultaneously insisting he “likes” the Chinese president. But the markets were hoping that the direct line between Washington and Beijing could ease trade tensions, even if temporarily. Well, that seems to have been the case judging by media reports that have emerged in the last hour or so, offering the markets some support. But traders will remain sceptical about any quick progress on a deal. So, it is super important that the Trump-Xi call now leads to some concrete movement, and quickly, for markets to justify buying the April dip this aggressively.

Weak US data raises Fed cut expectations
Ironically, the modest gains in equity markets over recent days have been partly driven by weaker economic data, as this has increased expectations of an earlier rate cut by the Federal Reserve. While the April JOLTS job openings report came in stronger than anticipated, it would be unwise to overemphasize this, given that several other macro indicators this week have been underwhelming.
Monday’s softer ISM manufacturing print was followed by a disappointing ADP payrolls report, which showed just 37,000 jobs added versus the 114,000 expected. More strikingly, the ISM services PMI fell back into contraction territory, coming in at 49.9 versus a forecast of 52, and down from the previous month’s 51.6. Notable declines were seen in business activity (down 3.7 points) and new orders (down 5.9 points), although the employment component did manage to edge back above the expansion threshold, reaching 50.7. Then, we had a bigger than expected rise in weekly jobless claims data today, printing 247K vs. 236K expected.
Altogether, the recent data has painted a rather downbeat economic picture, heightening concerns that the ongoing trade tensions under President Trump’s administration may be having a more pronounced economic impact than previously believed. While this week’s data has raised some eyebrows already, it’s Friday’s nonfarm payrolls report that could prove pivotal. The consensus expects a slowdown in job creation, with 127,000 new jobs forecast—down from 177,000 previously—while the unemployment rate is projected to hold steady at 4.2%.
Realistically, it would take a significant downside surprise to jolt markets out of their current lull and spark a meaningful rise in volatility.
Technical S&P 500 forecast: Key levels to watch
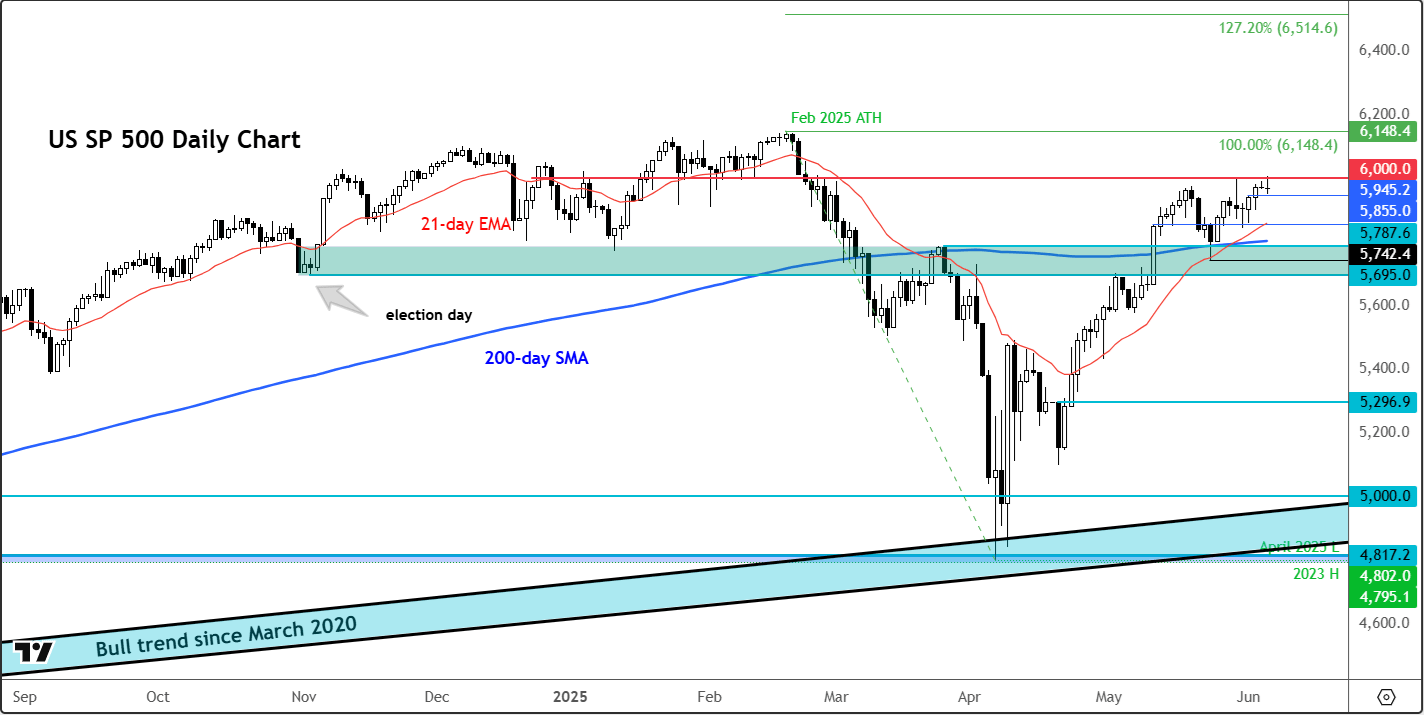
Source: TradingView.com
From a technical standpoint, the S&P 500 chart remains in bullish territory, though momentum has clearly faded. A decisive break above the key 6,000 resistance level could open the door for a potential move toward February’s record high of 6,148.
However, if the 6,000 barrier continues to hold, the bears would still need to engineer a full-fledged reversal—marked by breakdowns through multiple support levels—before a bearish S&P 500 outlook becomes justified. For now, that remains a tall order. The index has been comfortably trading above both its 21-day and 200-day moving averages, signalling that bearish control has largely dissipated.
In the near term, key support levels to monitor include 5,945, 5,855, and 5,787.
-- Written by Fawad Razaqzada, Market Analyst
Follow Fawad on Twitter @Trader_F_R
Latest market news
September 18, 2025 02:48 PM
June 23, 2025 01:22 PM
June 23, 2025 10:39 AM
June 20, 2025 05:23 PM
June 20, 2025 04:46 PM
June 20, 2025 03:35 PM

June 19, 2025 11:53 AM

June 19, 2025 08:48 AM

June 17, 2025 02:00 PM

June 16, 2025 04:17 PM