

After a choppy week, global markets were showing signs of stabilisation first thing this morning, although at the time of writing global indices were coming off their best levels. US index futures staged a modest rebound following Wednesday’s wobble, echoing gains seen across Europe and Asia. The move comes as investors digest a mixture of geopolitical headlines, central bank commentary, and a tech-led resurgence. President Trump’s claim of “big progress” in trade talks with Japan gave the Nikkei a 1.5% lift and helped tech shares rebound, with Taiwan Semiconductor’s steady 2025 outlook providing an added boost. But don’t get carried away – the market remains jittery. Fed Chair Jerome Powell’s mid-week remarks poured cold water on expectations of aggressive monetary support, stressing a more measured, wait-and-see approach. Traders will be watching ECB President Christine Lagarde closely now, after the central bank cut rates for the 7th consecutive time but warned of deteriorating growth outlook amid trade war risks. With the Easter long weekend just around the corner for many Western markets, the big question is whether this bounce can stick or if it’s just another false dawn in what’s been an increasingly erratic landscape. Our S&P 500 analysis suggests that technical levels are becoming more influential than ever, especially with macro narratives shifting daily.
Wall Street yes recovery after volatile week
After last week’s stellar rally, which saw the S&P 500 surge more than 13% from its multi-month low, this week’s action has been relatively more subdued, if still volatile. All three major US indices were lower on the week, in contrast to their European counterparts which have managed to hold in positive territory, at the time of writing. That divergence is telling: capital flows are showing signs of favouring European equities as a perceived safe haven, even while Wall Street attempts to claw back gains. Still, Wall Street shares could make a comeback if the trade war uncertainty subsides further.

Spotlight on Netflix earnings
Earnings season continues to provide moments of clarity amid the fog. Ahead of the bell, Blackstone, American Express, and Charles Schwab were in focus, but all eyes will be turning to Netflix, which reports after the close. Interestingly, Netflix has emerged as a relative outlier in this environment. While trade-related concerns have weighed heavily on broader tech, Netflix is up around 8% year-to-date. Investors see it as somewhat insulated from tariff pressures, and with its expanding advertising arm now contributing to the top line, sentiment remains resilient. Its stickiness – in terms of both subscribers and pricing strategy – continues to impress analysts.
S&P 500 analysis: Technical levels that matter the most
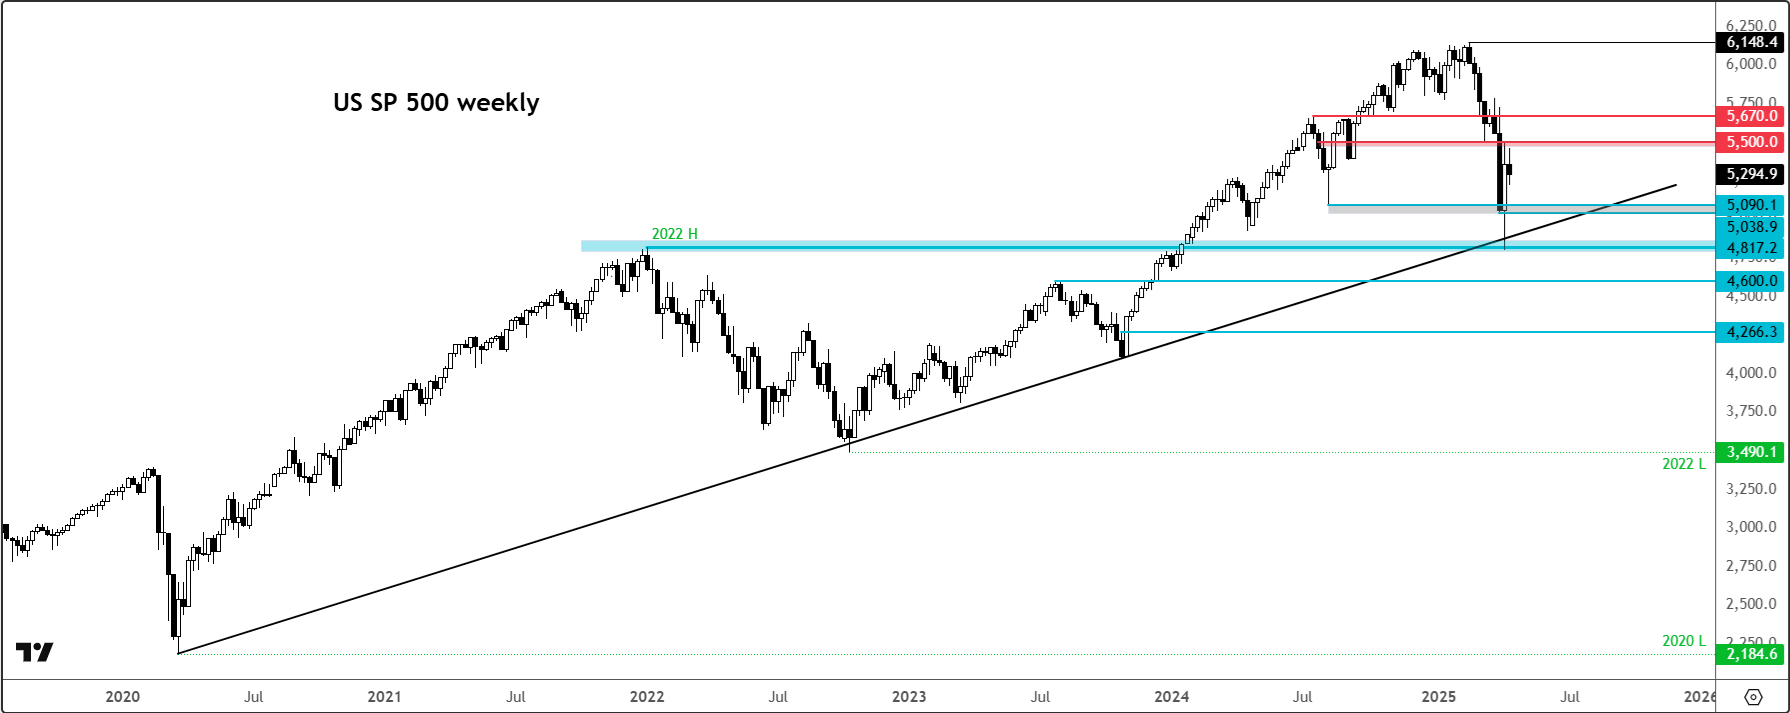
Turning to the charts, our S&P 500 analysis reveals a market at a technical crossroads. Last week’s powerful bounce found support exactly where bulls needed it – at the convergence of a long-term bullish trend line dating back to the pandemic lows and prior resistance-turned-support in the 4800–4820 zone. This is now the key long-term area to keep on the radar. Should sentiment sour again, this area will be critical to monitor for any fresh downside tests.
Also notable is the grey-shaded area between 5039 and 5090 on the above S&P 500 daily chart. Once support during the tariff-induced slump and now reclaimed, this zone could provide a sturdy floor if selling resumes. However, in reality, markets don’t always obey the script – caution remains warranted.
To the upside, resistance around the 5490 to 5500 area has held on the first test. Formerly support before the last breakdown, this area must be cleared convincingly to swing momentum back towards the bulls. Until then, any short-term bullish activity should be viewed with a healthy dose of scepticism.
Short-term S&P 500 technical analysis and level to watch
Zooming into the daily chart, the blue-shaded area between 5251 and 5220 is worth watching. This acted as support during Wednesday’s dip, and it will need to hold if we’re to avoid another trip south towards the longer-term levels mentioned above.
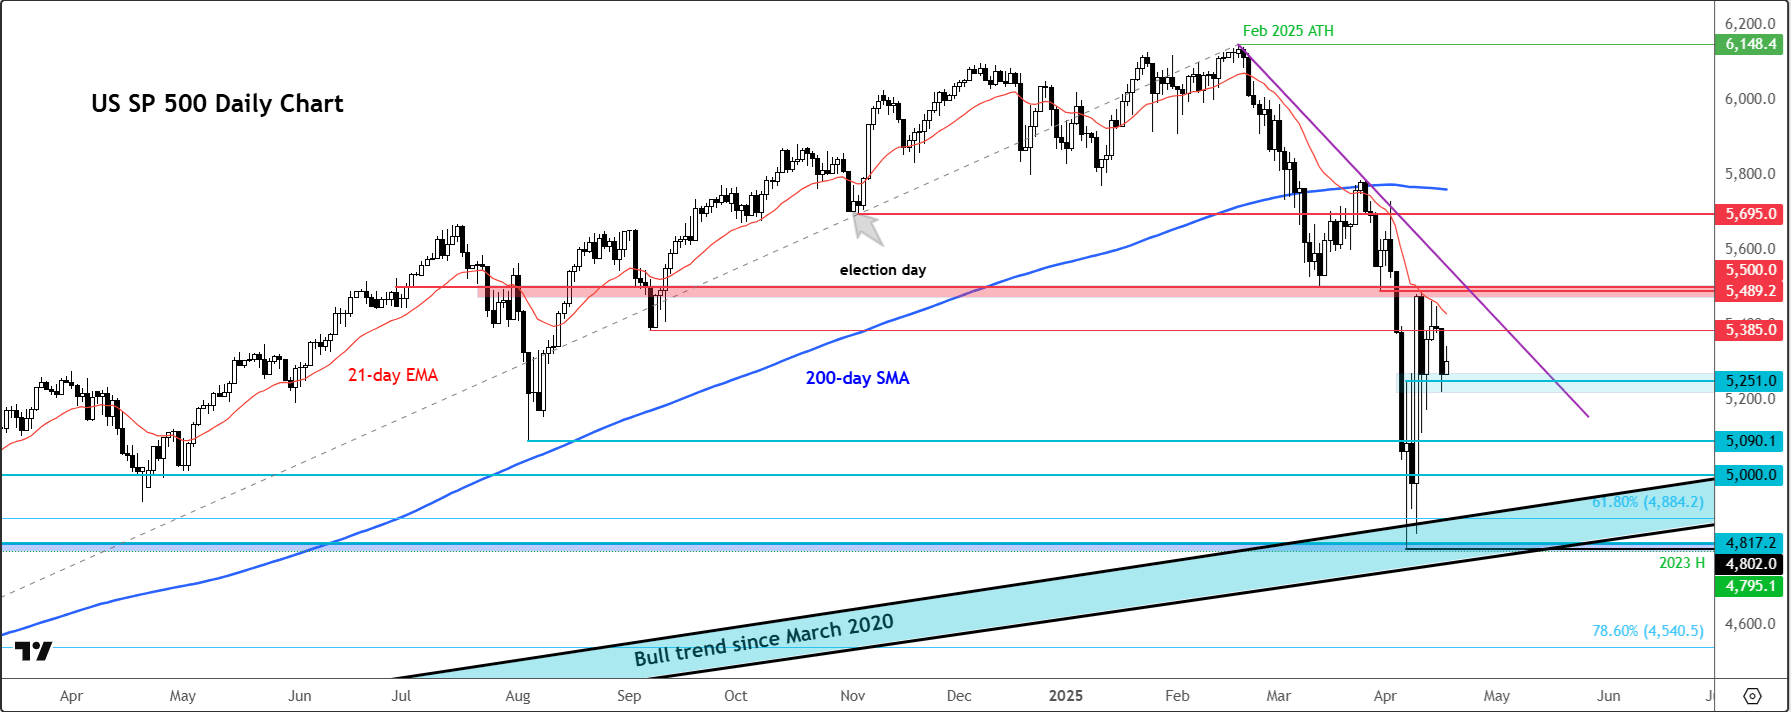
On the resistance side, the 5385 area – which had briefly turned into support earlier in the week – has now flipped back to resistance. Above this, we’re eyeing the 21-day exponential moving average and a more significant barrier between 5489 and 5500. Above this range is where a short-term bearish trend line that’s been intact since the February peak comes into play.
Trading strategy: Stay nimble and neutral
In such a headline-driven environment, rigid directional bias is a trader’s worst enemy. With volatility high and conviction low, our best S&P 500 analysis tip is to keep it level-to-level. Stay flexible. Look for reactive trades, rather than predicting where the market “should” go.
Think of it like navigating a maze where the walls shift each day. Play what’s in front of you, keep risk tight, and be ready to flip your view when the price action demands it. In this market, neutrality is not indecision – it’s discipline.
Source for all charts used in this article: TradingView.com
-- Written by Fawad Razaqzada, Market Analyst
Follow Fawad on Twitter @Trader_F_R
Latest market news

April 23, 2025 12:00 PM

April 20, 2025 05:00 PM

April 14, 2025 05:04 AM

April 9, 2025 12:30 PM