

After a mid-session drop following Canada’s announcement of new tariffs on $21 billion worth of US goods, US stock indices managed to stage a comeback. But is this the beginning of a meaningful recovery? The S&P 500 had been teetering on the edge of a technical correction, with tech giants bearing the brunt of the sell-off. However, Donald Trump’s shifting stance on trade tariffs—backing away from an additional 25% levy on Canadian exports—has reignited optimism that trade deals could still be on the table. Sentiment received an additional boost today as February inflation came in cooler than anticipated, propelling stocks higher after two days of steep declines. Techs were leading the charge with Nvidia up 6.7% and Tesla up 8% at the time of writing. Can the tech megacaps lead a market recovery and boost the short-term S&P 500 forecast?
Inflation data offers relief, but rate cuts remain uncertain
While the latest consumer price index (CPI) report showed the slowest pace of increase in four months, it does not necessarily signal an immediate policy shift from the Federal Reserve. The expectation remains that tariffs could drive up costs on a wide range of goods, testing consumer resilience and economic stability. Still, the inflation figures are positive for risk assets, as they provide reassurance that prices are not surging uncontrollably—and breaking the alarming trend seen in the last few months. This should give the Fed some breathing room to act if labour market conditions weaken. However, despite today’s lower CPI reading, the central bank is unlikely to rush into rate cuts. With continued uncertainty around trade policies and immigration, policymakers will need to see sustained favourable inflation data before making any decisive moves. And that view was mirrored in the FX price action in the immediate aftermath of the CPI release, with the dollar quickly bouncing back after its initial falls, although it later resumed lower again.
Trade war tensions remain a dominant market force
Trump’s 25% tariffs on steel and aluminium imports took effect today, sending shockwaves across export-dependent economies in Asia and prompting immediate retaliatory measures from the European Union and Canada. The latest US tariffs followed a chaotic day yesterday at the White House, during which Trump threatened to double Canada’s metal tariffs to 50%. However, after Canada’s government abandoned plans to impose an electricity surcharge on US exports, Trump softened his stance, and up went stocks.

Technical S&P 500 forecast: Will we see sustainable recovery?
The markets have tried – and failed – to create a turning point in the last few sessions. But with tech megacaps bouncing back and markets being severely oversold in the short-term view, can the S&P 500 stage a more significant recovery from here?
One consistent theme in this long-running bull market is that every notable sell-off has been met with aggressive dip-buying, pushing indices to new highs. Despite persistent macroeconomic concerns—whether it was the COVID-19 crash, the unwinding of yen carry trades in 2024, China’s economic struggles, Russia’s invasion of Ukraine, or the inflation-driven bear market of 2022—investors have repeatedly stepped in. The key question now is whether we are on the cusp of another resurgence or if the market is set for a deeper pullback.
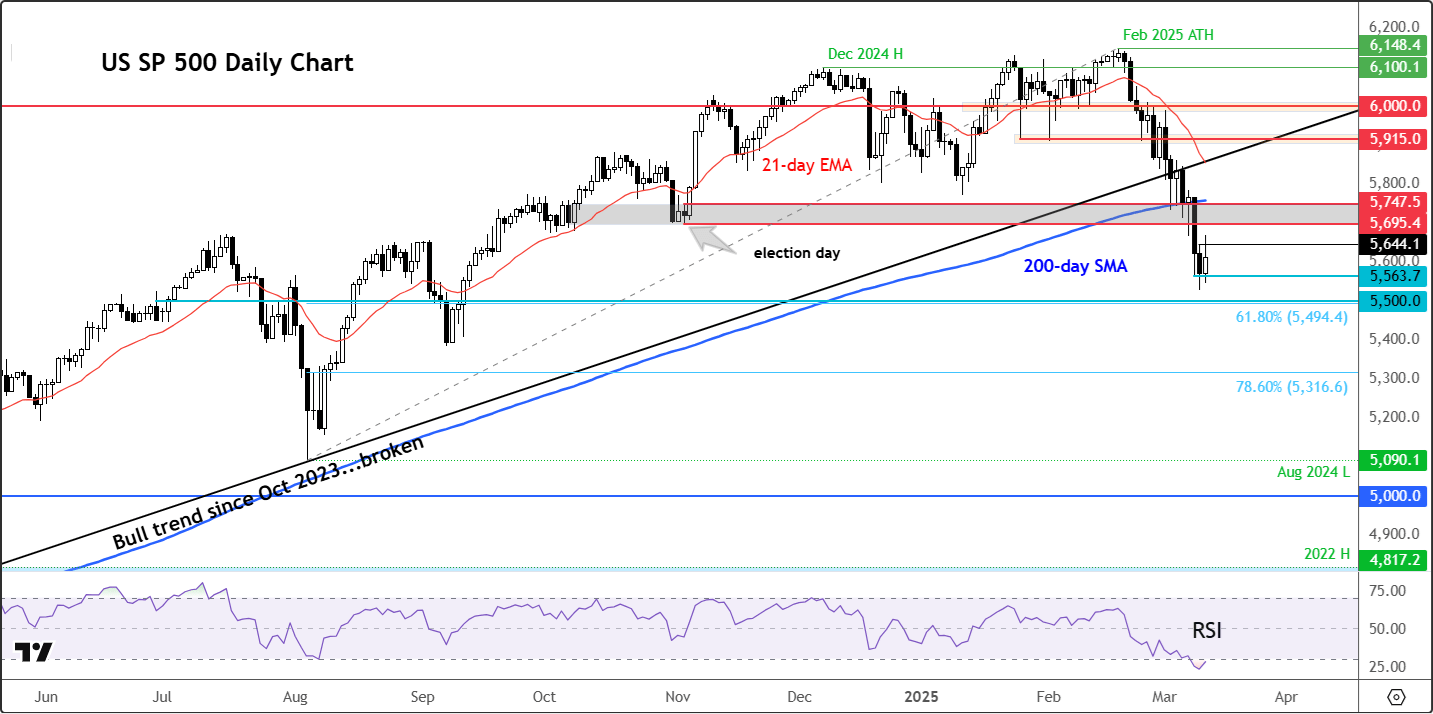
Source: TradingView.com
The S&P 500 chart has recently found support around the 5528-5565 region. With the daily RSI now firmly in oversold territory, the potential for a further rebound remains strong.
On the upside, initial resistance stands at 5695—the low from election day, which preceded an 8% surge that lasted until February. Beyond that, further hurdles emerge at 5747, with the 200-day moving average looming around 5760. If dip buyers return with force, these levels could come into play in the coming sessions.
But should selling pressure resume, the next critical support level below this week’s low lies between 5495 and 5550, corresponding to the 61.8% Fibonacci retracement of the last major rally from August.
-- Written by Fawad Razaqzada, Market Analyst
Follow Fawad on Twitter @Trader_F_R
Latest market news

April 25, 2025 02:00 PM

April 23, 2025 05:12 PM

April 23, 2025 12:00 PM