

Equities Technical Forecast: Weekly Trade Levels
- Stocks stage massive recovery off yearly lows- rallies extend /close near highs on NFP beat
- S&P 500, Nasdaq erase Liberation Day sell-off as bulls eye Fed interest rate decision
- Battle lines drawn on the SPX, NDX, and DJI weekly technical charts
S&P 500 Price Chart – SPX500 Weekly
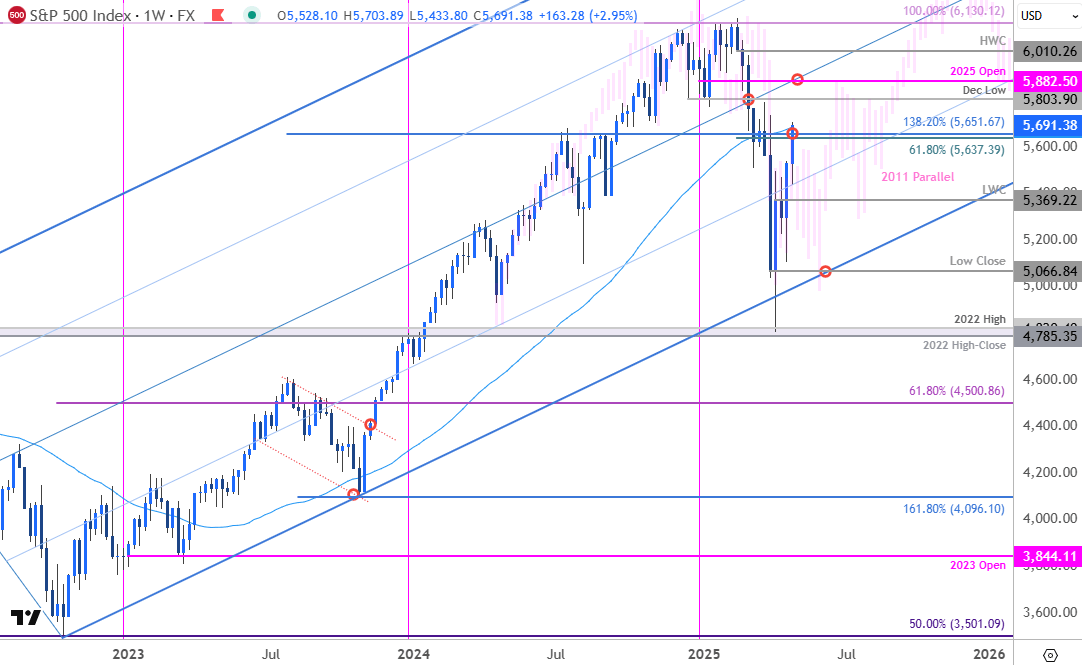
Chart Prepared by Michael Boutros, Sr. Technical Strategist; S&P 500 on TradingView
Technical Outlook: The S&P 500 plunged more than 21.8% off the yearly high with the index rebounding off technical support last month at the 2022 high-close / swing high at 4785-4820. On a close basis, the 2022 uptrend is preserved and SPX500 has now recovered the entire ‘Liberation Day’ decline in a four-week rally extending nearly 18.7% off the yearly low.
The advance closed above a key pivot zone on Friday at 5637/83- a region defined by the 61.8% retracement if the yearly range, the 1.382% extension of the 2022 advance, and the 52-week moving average. Note that price has been tracking a parallel to the 2011 recovery (in pink). While the breadth of the April rebound suggests a low may be in place, this reference highlights the threat of a potential retest of trend support before resumption of the broader uptrend.
S&P 500 Price Chart – SPX500 Daily
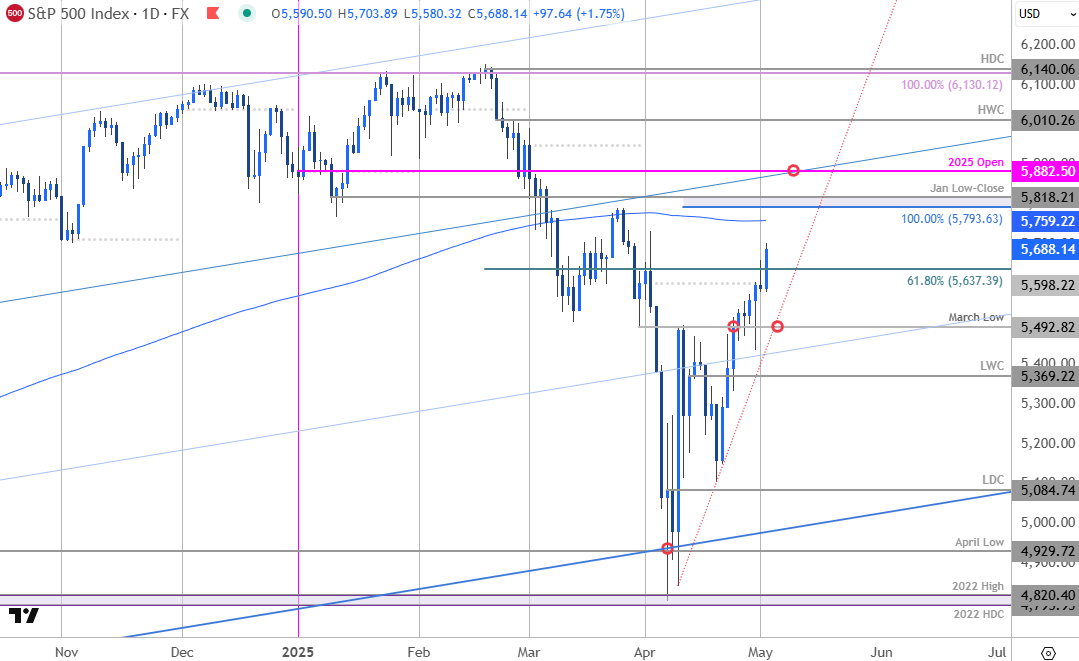
Chart Prepared by Michael Boutros, Sr. Technical Strategist; S&P 500 on TradingView
A closer look at the daily chart highlights the speed of this recovery with the index now extending towards the 200-day moving average near ~5759. The next major technical considerations are eyed at the 100% extension of the April rally / January low-close at 5793 and the objective yearly open at 5818. Ultimately, a topside breach / close above the median-line is needed to mark uptrend resumption.
Initial support now rests with the March low at 5493 and is backed by the yearly low-week close (LWC) at 5369- losses below this threshold would once again threaten a test of the multi-year uptrend / the low-day close (LDC) at 5084.
Bottom line: The S&P 500 has staged an impressive rally off multi-year uptrend support with the recent recovery re-taking the yearly moving average. From a trading standpoint, losses should be limited to 5493 IF price is heading higher on this stretch with a breach above 5882 needed to challenge the highs.

Nasdaq Price Chart – NDX Weekly
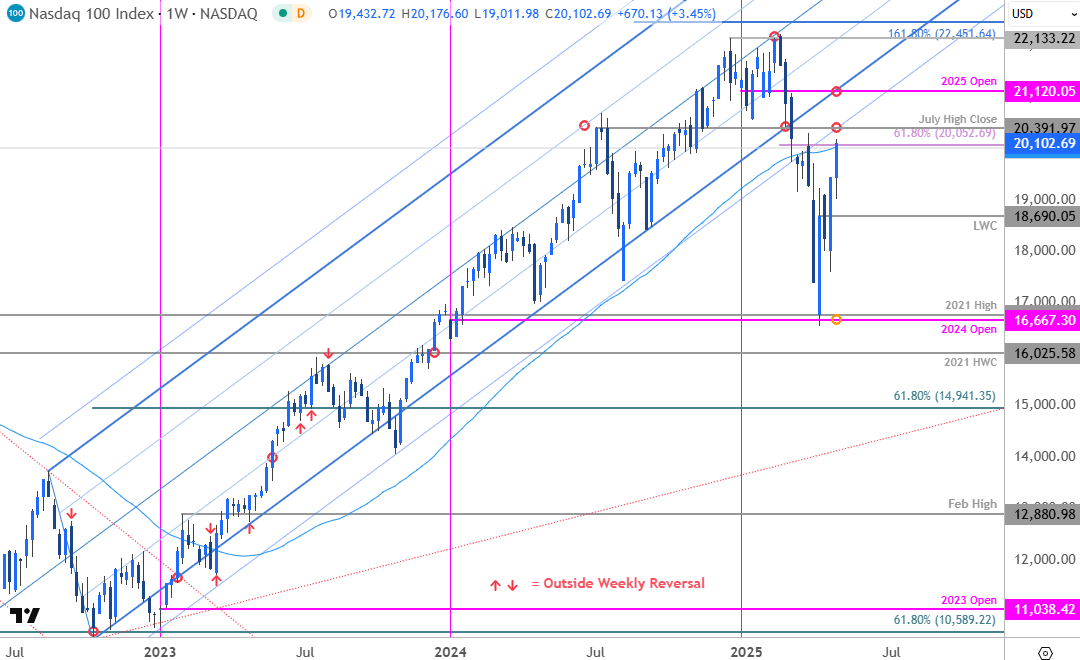
Chart Prepared by Michael Boutros, Sr. Technical Strategist; NDX on TradingView
Technical Outlook: Nasdaq saw the largest share of the risk sell-off with a decline of more than 25.5% from the yearly highs. The decline gapped into and found resistance at the 2024 yearly open / 2021 high last month near 16,667/764. The bulls have enjoyed the largest recovery of the majors with NDX extending nearly 22% off the lows- resistance now in view.
The rally closed just above the 52-week moving average / 61.8% retracement of the yearly range at 20,020/52 but just below the 200-day moving average at 20,176. The immediate focus is on a breakout of this range for near-term guidance.
Bottom line: Nasdaq is now approaching resistance at former support near the 2022 uptrend. From a trading standpoint, losses would need to be limited to the LWC at 18,690 IF the index is heading higher on this stretch with a breach / close above the yearly open at 21,120 needed to suggest a more significant low is in place.
Dow Jones Price Chart – DJI Weekly
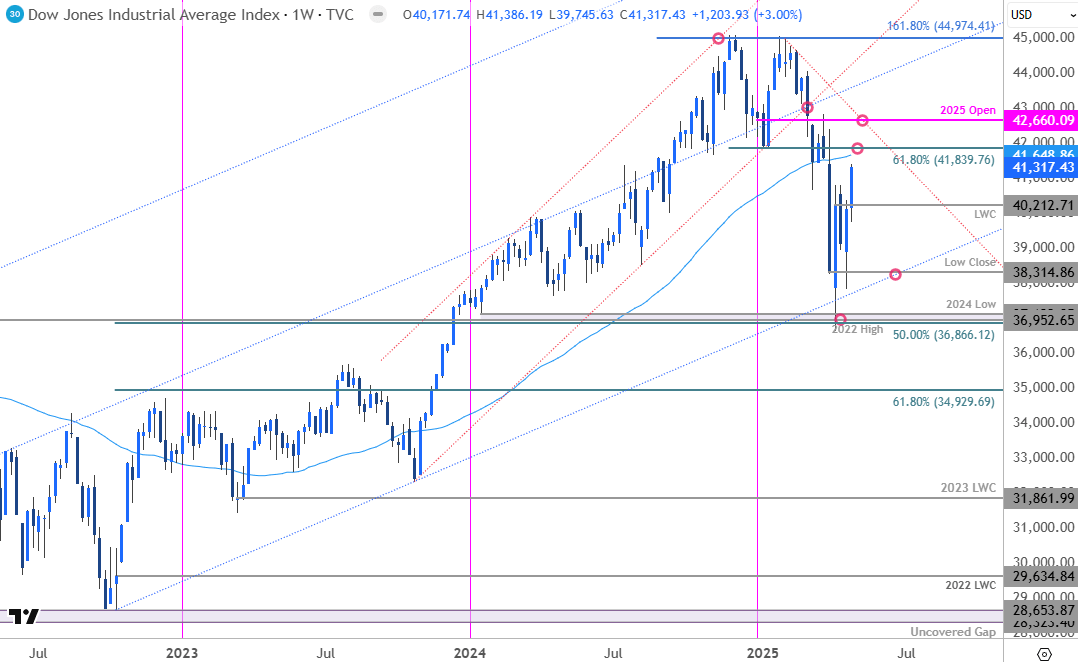
Chart Prepared by Michael Boutros, Sr. Technical Strategist; DJI on TradingView
Technical Outlook: The Dow briefly registered an intraweek low just below a key support pivot last month at 36,866-37,123 before reversing sharply with the 2022 uptrend still intact. The index has now recovered more than 13% off the lows with DJI eyeing weekly resistance near the 52-week moving average / 61.8% retracement of the November decline at 41648/839- looking for a larger reaction there IF reached.
Bottom line: The Dow would need to hold initial weekly support near the LWC at 40,212 IF the index is heading higher on this stretch with a breach / close above the yearly open at 42,660 needed to suggest a more significant low is in place.
Key Economic Data Releases
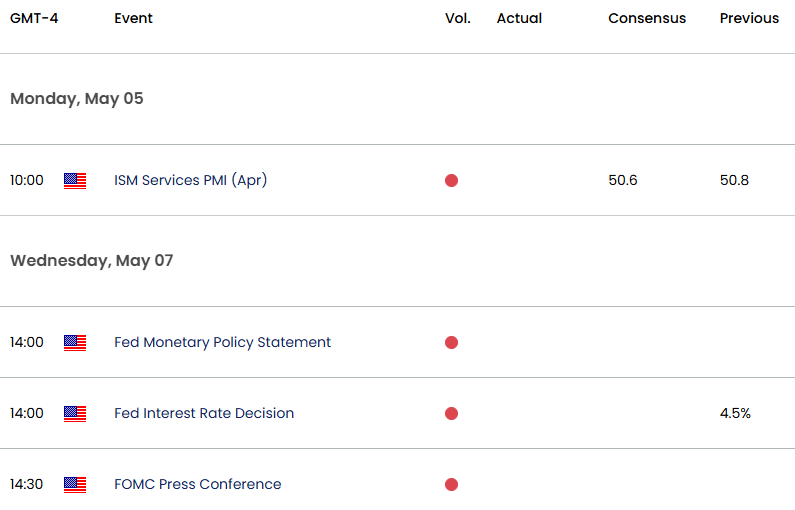
Economic Calendar - latest economic developments and upcoming event risk.
Active Weekly Technical Charts
- Swiss Franc (USD/CHF)
- Japanese Yen (USD/JPY)
- Crude Oil (WTI)
- Australian Dollar (AUD/USD)
- British Pound (GBP/USD)
- Canadian Dollar (USD/CAD)
- Euro (EUR/USD)
- US Dollar Index (DXY)
--- Written by Michael Boutros, Sr Technical Strategist with FOREX.com
Follow Michael on X @MBForex
Latest market news
September 18, 2025 02:48 PM
June 23, 2025 01:22 PM
June 23, 2025 10:39 AM
June 20, 2025 05:23 PM
June 20, 2025 04:46 PM
June 20, 2025 03:35 PM

June 17, 2025 08:37 AM

June 16, 2025 08:38 AM

June 2, 2025 08:50 AM

May 28, 2025 02:31 PM