

S&P 500 Talking Points:
- It was another rough week for SPX as the index gapped-down from the prior weekly close and failed to fill that gap in later-week trade.
- There was a bounce on Friday to go along with RSI pushing back above the 30-level on the daily chart of SPX, but there remains a bearish overhang for equities given the size of the sell-off over the past month.
- A big area on the chart remains in-play around the 5638-5670 zone. Bulls drove above that level for the weekly close, opening the door for a continued support bounce if buyers can continue to push through next week.

It was another brutal start to the week for stocks as the S&P 500 gapped-down on Monday and continued to slide through the Tuesday open. A combination of recession worries and tariff confusion have taken over media headlines and investors have responded as they often do to unquantifiable risk – and that’s with aversion.
While the post-election backdrop was driven with uncertainty front-and-center, the fact that President Trump hasn’t altered his approach even in the face of falling prices is likely a primary culprit behind the sell-off, as confidence that the U.S. President could shift his course in order to ease the worries from equity investors had previously helped stocks to remain strong even amongst tariff talk and growth worries (which could be offset by rate cut hopes).
It was the first couple weeks of the New Year when a pullback took place, leading to the fill of the election gap on January 13th. But, as inauguration neared equities roared back to life, with SPX hitting a fresh ATH less than two weeks after testing that support; and that strength largely remained through the first few weeks of February. Since then, however, worry has taken over and that’s shown in equity indices as the S&P 500 has now posted four consecutive weekly losses, starting with a bearish engulfing formation in late-February.
The 5638-5670 zone remained key last week, however, and this is the ‘s2’ zone that I had looked at in the 2025 forecast for equities. This is the 161.8% extension of the 2022 sell-off spanned up to last July’s swing high. The top of this zone held the low in the prior week, and the bottom of this zone came in to hold the weekly close last week, giving hope that bulls might be able to stage a larger run of recovery after the bearish engulf appeared at the 100% extension of the 2022 sell-off just four weeks ago.
SPX Weekly Price Chart
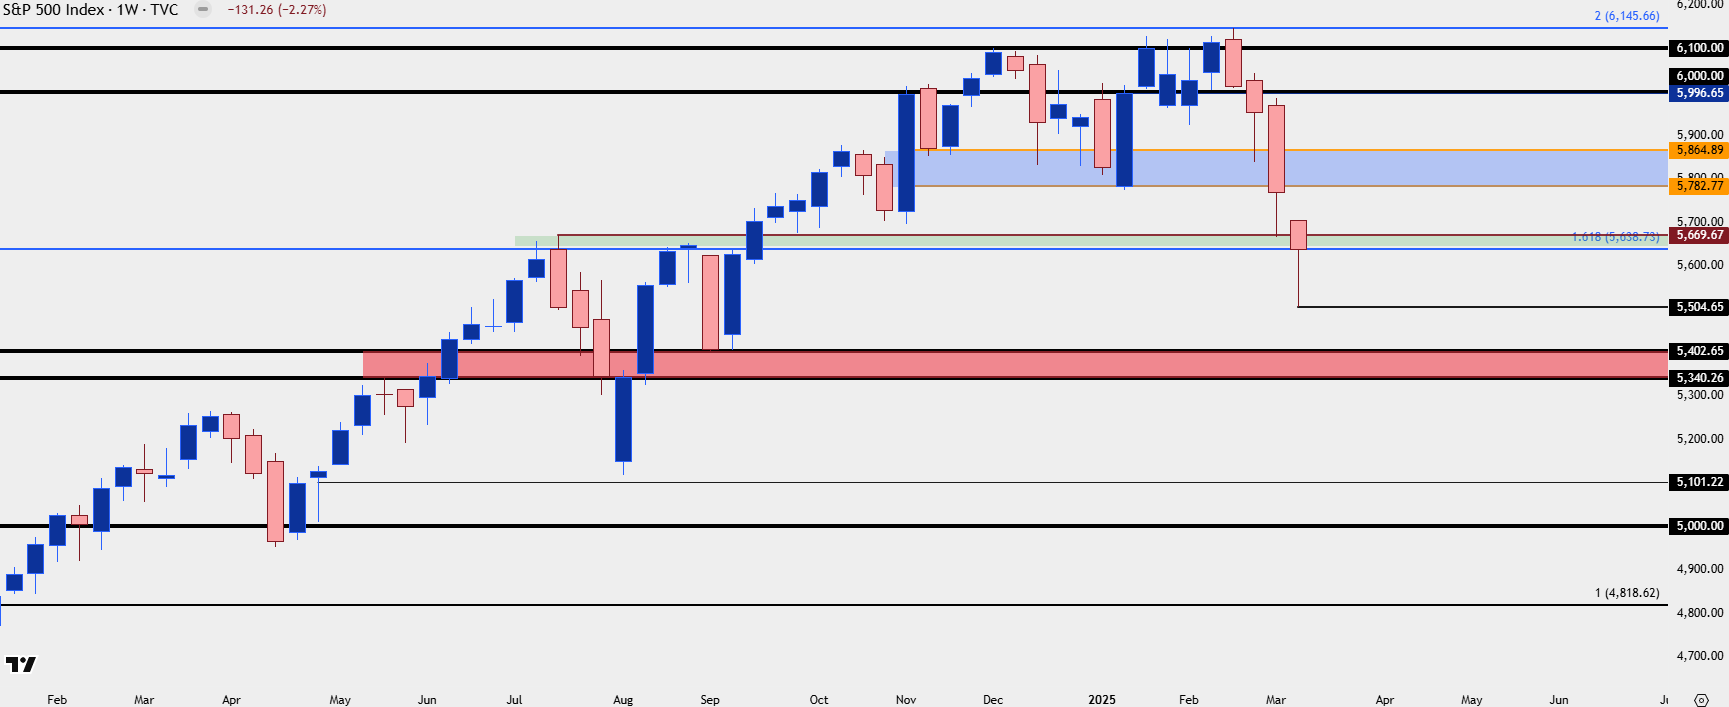 Chart prepared by James Stanley; data derived from Tradingview
SPX for Next Week
For next week the big question is whether sellers make another early week show of force, and if they do, there’s one more key support zone that I’m tracking for my top trade idea for 2025, and it’s just a little bit lower on the chart. It was a big area of resistance in May and June only to become support in September, and it spans from 5340 up to 5402. An underside wick on the daily chart around that zone would open the door for short-term reversal potential.
Alternatively, another show of resistance on the daily at the 5638-5670 zone would keep the door open for another push lower as that would be an open area for sellers to show lower-high resistance. This would need to see the weekly open grind sideways followed by a seller reaction to the support-turned-resistance zone, at which point bearish continuation on the daily chart can remain in effect.
However, if bulls can mount a comeback over the 5638-5670 zone, which would need to show both higher-highs and higher-lows on the hourly or four-hour chart, then I think larger bullish scenarios could be entertained with the next area of interest in that same area of the election gap, starting around 5782 and running up to around 5865.
SPX Daily Chart
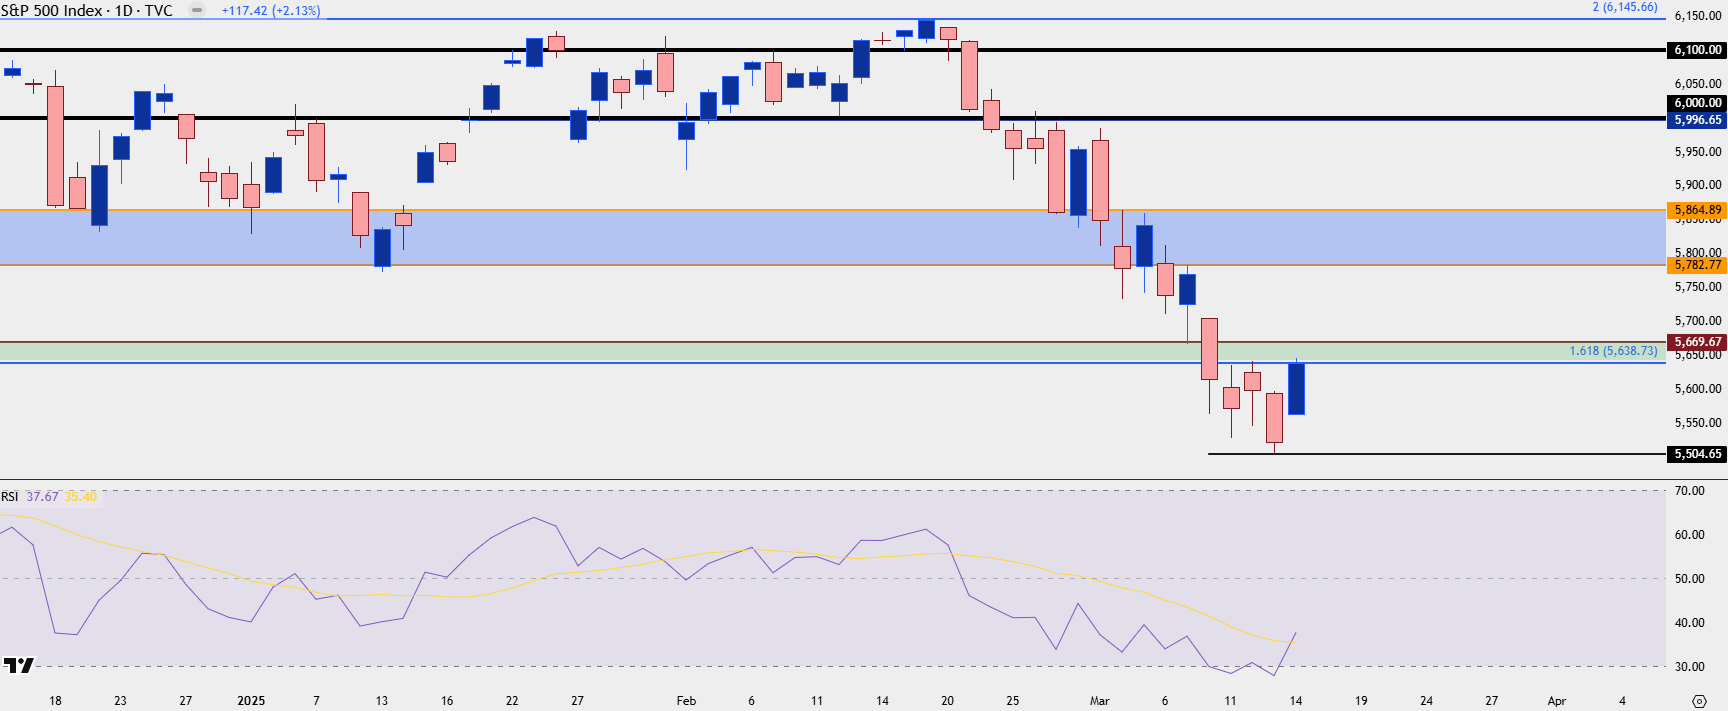 Chart prepared by James Stanley; data derived from Tradingview
--- written by James Stanley, Senior Strategist
Latest market news
September 18, 2025 02:48 PM
June 23, 2025 01:22 PM
June 23, 2025 10:39 AM
June 20, 2025 05:23 PM
June 20, 2025 04:46 PM
June 20, 2025 03:35 PM

June 20, 2025 04:46 PM

June 18, 2025 07:38 PM

June 18, 2025 03:31 PM

June 17, 2025 06:24 PM