

S&P 500, SPX, Stocks Talking Points:
- As we approach the June open the environment has changed dramatically from the April open.
- While calls for ‘Black Monday’ were spreading from some famous financial pundits on the first weekend of April, the result in the two months since has been considerably different, with the S&P 500 rallying by more than 22% from the early-April lows.
- I look into equity indices like SPX in each weekly webinar. Click here to register.

There’s one month left in Q2 but it’s already been a sharp turn across several markets. As we opened into April there was palpable fear as the prospect of tariffs loomed, but it was the Liberation Day announcement of what those tariffs were expected to be that sent shockwaves through global risk markets. It was a punishing end to the first week of Q2 as SPX dipped below 5k for the first time since last April, when the big figure showed as support before bulls continued the move to eventual ATHs.
But what made that early-April sell-off even more dramatic was the fact that suddenly, after 15 years since the Financial Collapse, the Fed put was nowhere to be seen. And while Trump is often considered to be focused on the stock market, at the time, it seemed his intent was more focused on bonds and long-term yields. There was no safety net as global markets had become accustomed to, even during the Fed’s rate hike campaign in 2022.
But that fear proved to be short-lived. It did make for a climactic first weekend of April as a notable financial pundit went on social media to broadcast their prediction for a ‘Black Monday’ type of event. But, at the time, S&P 500 futures were nearing a massive spot of support, at the 50% marker of the 2022-2024 major move, and the index went oversold on the weekly chart for the first time since the pandemic; both factors that made it more challenging for sellers to push an already developed move.
S&P 500 Futures Weekly Chart
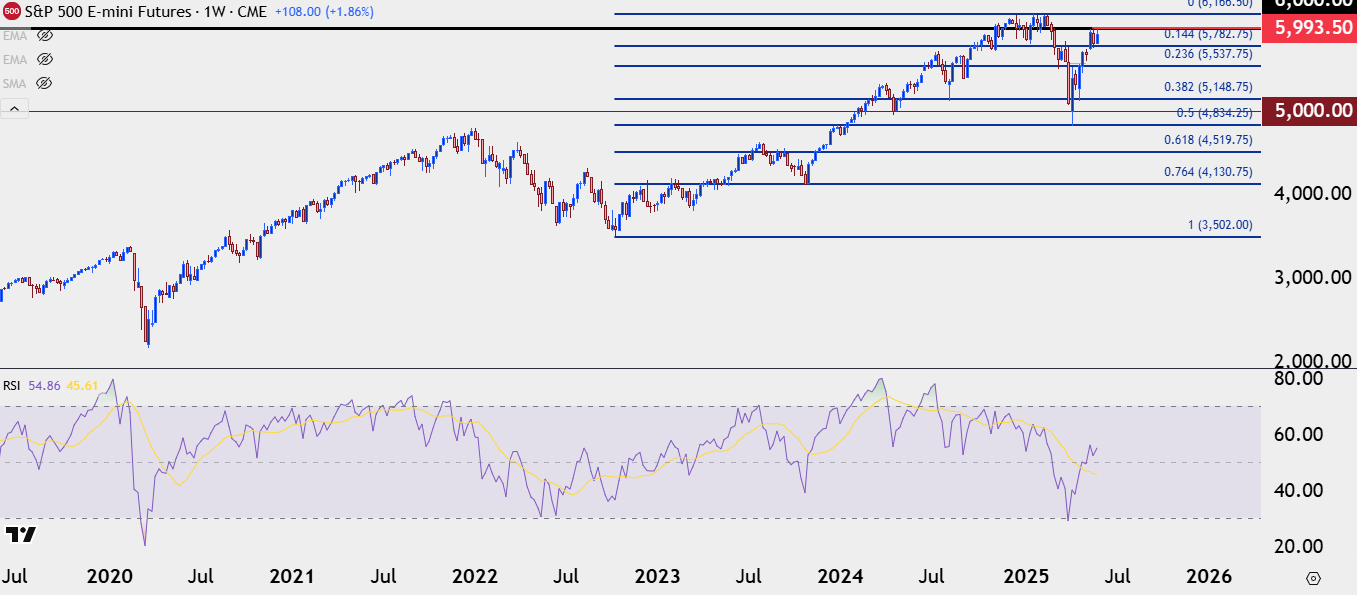 Chart prepared by James Stanley; data derived from Tradingview
S&P 500 Recovery
What happened after that rocky open to April was aggressive. S&P 500 futures had sold off by -21.64% from the February high to the April low. But it was around that Monday open that Trump started to show indication of softening his stance on the Liberation Day tariffs. Initially, it was a news report that was walked back, indicating a 90-day delay in tariff implementation. This gave a strong rally that soon pared back; but on the following Wednesday, that’s precisely what we heard, and the S&P 500 put in one of its strongest days – ever – on the back of that drive.
A move of that nature is likely at least partially driven by short cover. But for S&P 500 futures to rally 10%, there’s also probably some legitimate bullish exposure being taken on. And in the almost two months since stocks have only continued that rally.
While it was down by -21.64% from February into April, the index has now risen by as much as 24.04%, to re-test the vaulted 6k figure for S&P 500 Futures. Perhaps more interesting is the look of the monthly bar that is now nearing completion.
S&P 500 Daily Price Chart
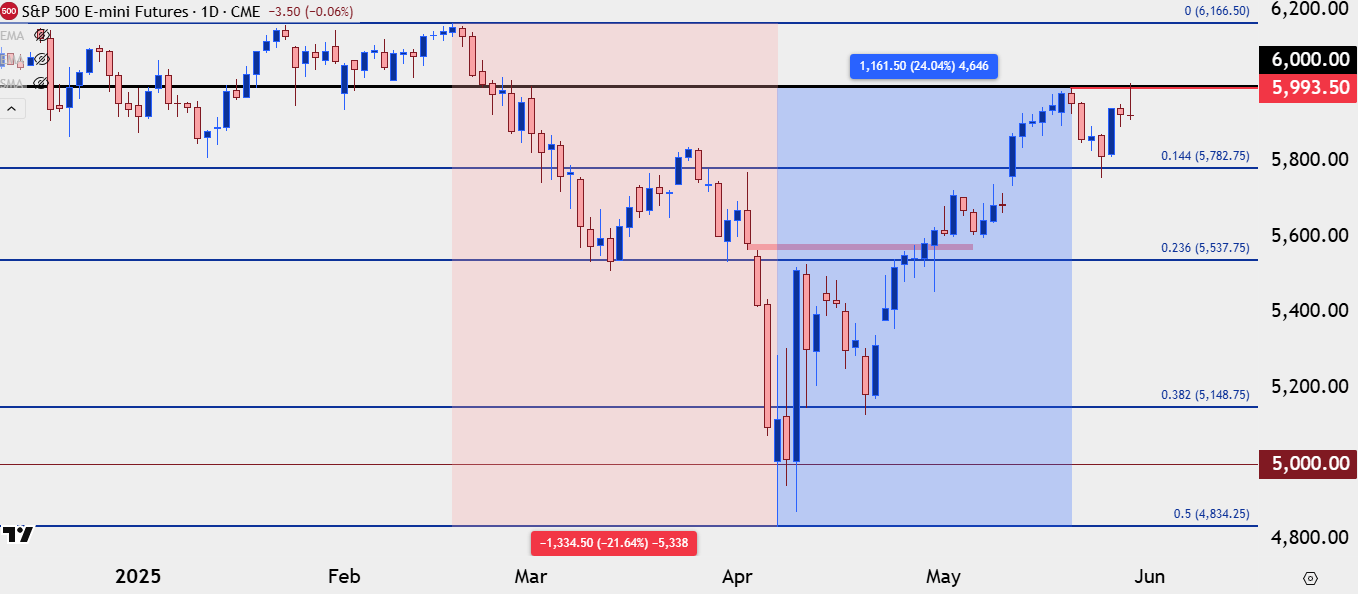 Chart prepared by James Stanley; data derived from Tradingview
S&P 500 Big Picture
That monthly bar in S&P 500 futures is notable as there haven’t been many underside wicks like what we saw in April. That monthly bar closed very near where it opened, making the case as a long-legged doji which illustrates indecision. But the follow-through in May is what’s important as we’ve now seen the intra-month reversal that allowed for the erasing of prior losses lead into a month of strength, as the index headed back up to the 6k level.
As I write this there’s a little more than a day and a half left of May trade, so this can change. But – as I showed in yesterday’s webinar, if price does complete the morning star formation that illustrates bullish continuation potential – and there’s a very obvious spot overhead that sits as next resistance at 6166.50 as this held the highs for three months, until the turn appeared in March.
S&P 500 Futures – Monthly Chart
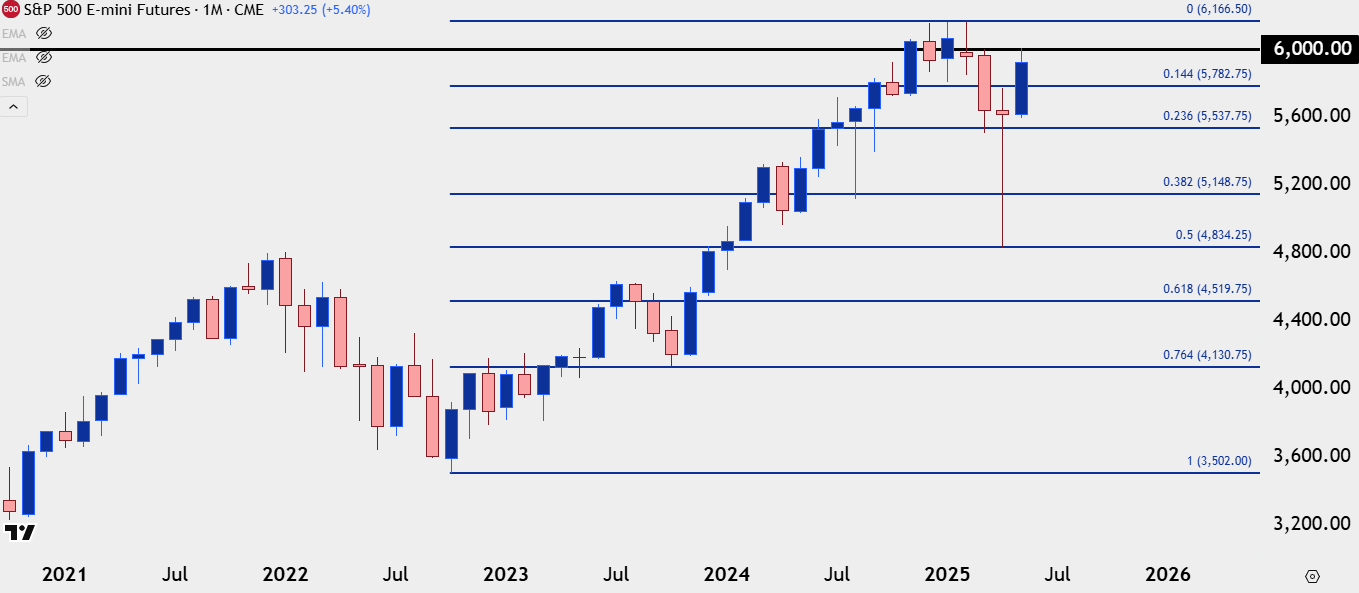 Chart prepared by James Stanley; data derived from Tradingview
S&P 500 Near-Term Strategy
Taking a longer-term view or trend and then dialing down into shorter-term strategy or positioning requires usage of multiple time frames. And while the prospect of continuation remains attractive from a few different vantage points, the fact of the matter is that bulls haven’t yet shown an ability to take out the 6k level in S&P 500 futures. And perhaps more to the point, the topside trend has been driving aggressively for the past almost two months, so, logically, there might be quite a few longs looking to take profit if we do stall at that psychological level.
This can lead to a couple of different approaches: Traders can look to trade outside price action by working with breakouts at the 6k level. Given the prior resistance at the 6166.50 level, there would be an obvious next topside target for trend continuation.
Inside price action would be looking for a pullback, and there’s a few spots where that’s of interest. Last week saw support at a Fibonacci level of 5782.75, and that would remain as a possible support. But there’s also some unfilled gap from early-May, spanning the approximate 50-point range from 5684-5734.25. That zone can even be synced down to the 61.8% retracement of the pullback move which plots at 5,656.75.
And as a third spot of support, I’m tracking the 50% marker of that pullback move up to the 23.6% retracement of the 2022-2024 move, spanning from 5499.25 up to 5537.75. This would be the spot that bulls need to hold to retain control, or else, there’s larger fear of bigger breakdowns in store.
S&P 500 Futures – Daily Chart
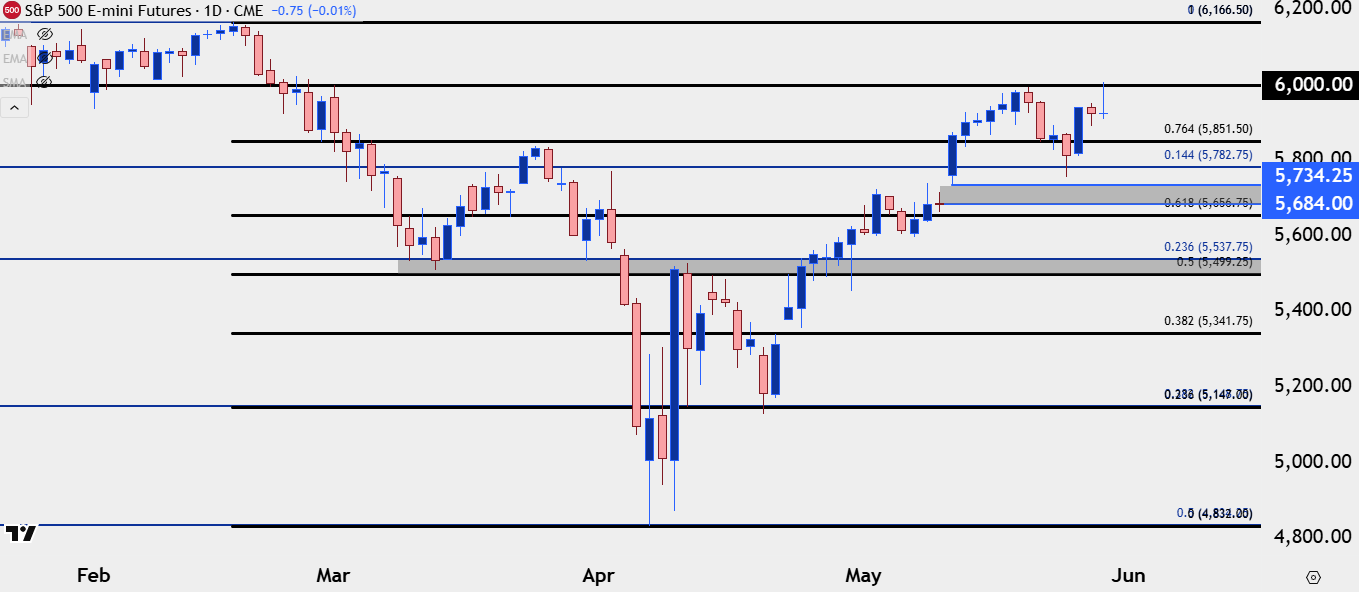 Chart prepared by James Stanley; data derived from Tradingview
--- written by James Stanley, Senior Strategist
Latest market news
Yesterday 06:17 PM
Yesterday 04:45 PM
Yesterday 03:45 PM

May 29, 2025 11:30 AM

May 28, 2025 08:48 AM

May 21, 2025 08:23 AM

May 19, 2025 08:19 AM