

S&P 500 Talking Points:
- The initial reaction to US CPI was strong in equity futures ahead of the open, with the e-mini S&P putting in another test of the 5500 resistance zone. That enthusiasm couldn’t hold through the cash open however as a pullback appeared shortly after.
- The next week is big:Tomorrow brings the European Central Bank and then next Wednesday brings the Fed with the expected start of a rate cutting cycle. While 50 bps appears to be off the table for now, the Fed will provide updated projections that can further drive rates markets and, in-turn, equities.

The 5500 resistance zone remains a big spot in S&P 500 futures and this morning is showing another sizable reaction to that area on the chart. This was support last week until getting traded through on Friday morning, and for the past 24 hours it’s been back-in the picture as resistance.
Taking a step back, there’s some price structure that’s of interest, as the sell-off last week was a rather clean 50% retracement of the August bounce. This also highlights some additional levels of interest, as the 38.2 and 23.6% retracements from that same Fibonacci study could garner interest.
There’s also some context from the July sell-off that ran into August, with the 50% marker of that major move at 5420.75, and as I shared in yesterday’s webinar, if buyers can defend that, it would open the door for higher-low support above last Friday’s swing-low in the 5400 area.
If bulls can’t hold price up above that prior swing low, however, the next zone of support that I’m tracking was the same resistance in-play in early-August, from around 5330-5350.
S&P500 Four-Hour Price Chart
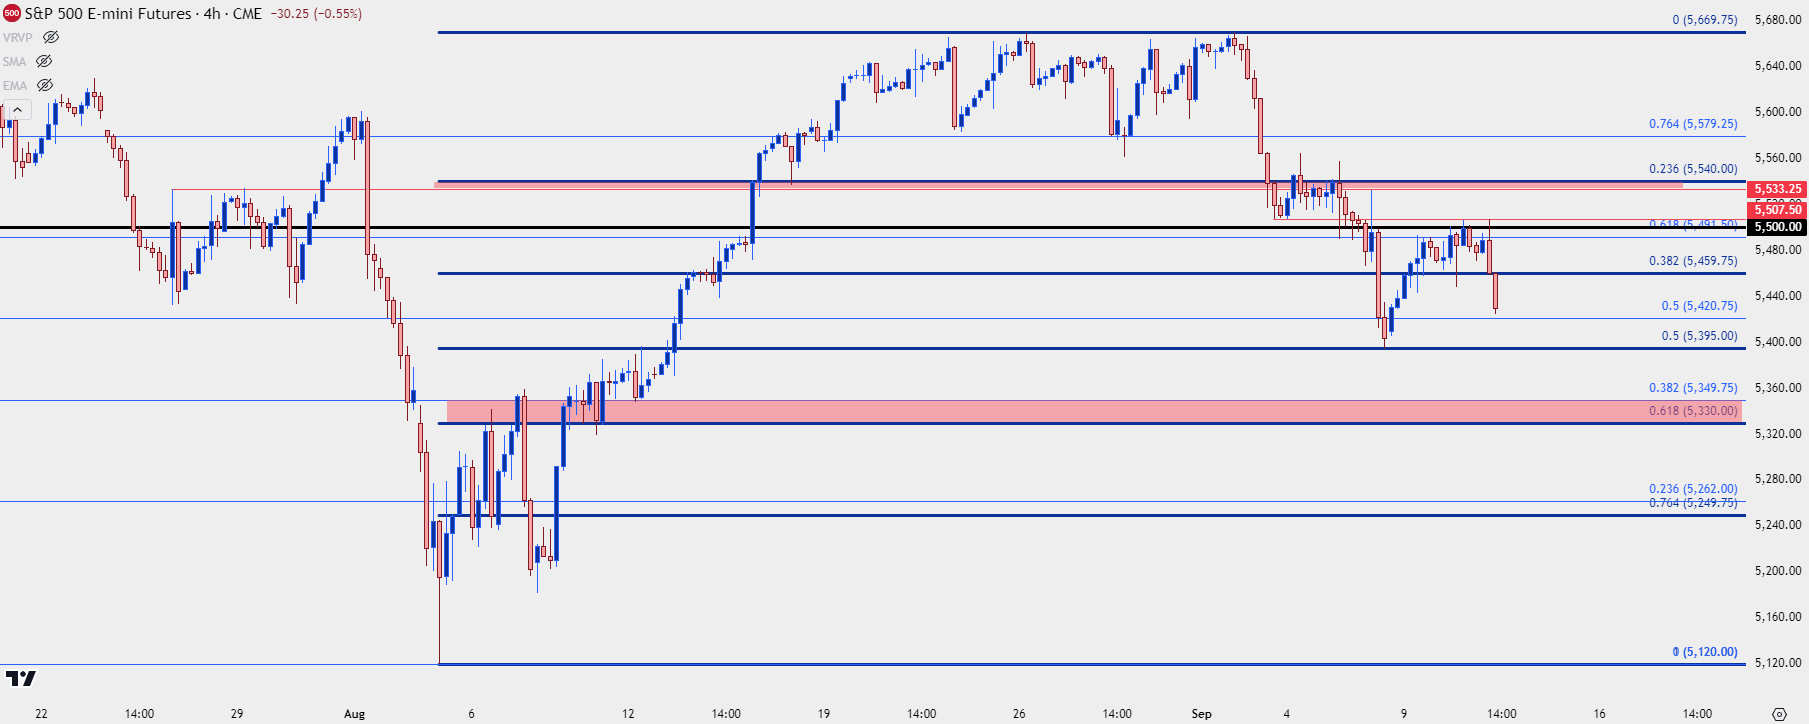 Chart prepared by James Stanley; data derived from Tradingview
S&P 500 Shorter-Term
Sellers made a statement last week but so far this week, a different tone had showed ahead of this morning’s CPI print. I’m still cautious of chasing on either side, however, and at this point, the same zone looked at in yesterday’s article for possible higher-low support remains in-play today. The below chart has some additional context to that 5420.75 level, with a Fibonacci extension plotted at 5434.75.
If buyers can hold that, the next test that I’m looking for would be at the 5462.50-5459.75 zone. And if sellers show up there, that could constitute a shorter-term lower-high which would keep the door open for a re-test of 5400. But, if bulls can break through that could arrange another test of the 5491.75-5500 zone which, so far, has been a tough area for buyers since it showed as support last week.
S&P 500 Futures Hourly Chart
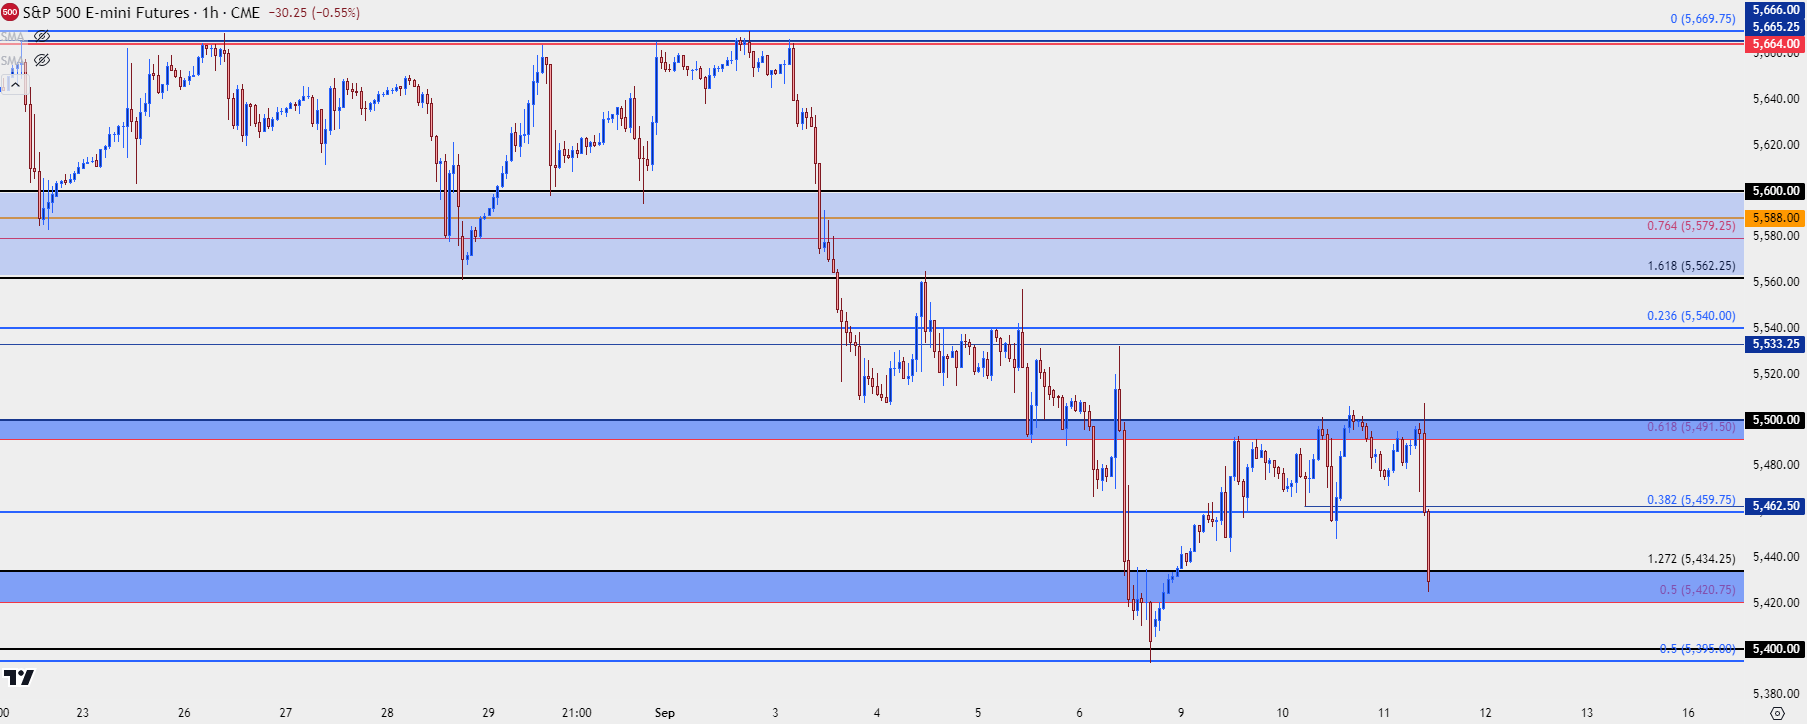 Chart prepared by James Stanley; data derived from Tradingview
--- written by James Stanley, Senior Strategist
Latest market news
September 18, 2025 02:48 PM
June 23, 2025 01:22 PM
June 23, 2025 10:39 AM
June 20, 2025 05:23 PM
June 20, 2025 04:46 PM
June 20, 2025 03:35 PM

June 17, 2025 08:37 AM

June 16, 2025 08:38 AM

June 2, 2025 08:50 AM

May 28, 2025 02:31 PM