

S&P 500 Talking Points:
- It’s been a big week for stocks with the S&P 500 getting a large boost after the US CPI report, although the bullish impulse was not immediate.
- Yesterday saw continuation and at this point, S&P 500 futures are working on their fifth consecutive daily gain, coming on the heels of a four-day sell-off last week.
- I’ll be looking into these setups in the Tuesday webinar and you’re welcome to join, click here for registration information.

Stocks have again showed an astounding recovery after doubt had started to creep-in. This time, there was no commentary from the Fed at the source of the drive, although noted ‘Fed-whisperer’ Nick Timiraos from the Wall Street Journal did have some comments regarding rate cut potential for next week; and he’s been incredibly well-sourced in the past, so markets are back to a veritable coin flip for whether we get 50 or 25 bps of softening at next week’s meeting.
I had looked into the larger backdrop for S&P 500 futures on Wednesday, after the CPI report – but before bulls had staged their full-on attack. At the time the 5420 level was coming into play after a strong sell-off from 5500 resistance; and as I had highlighted there, a hold around 5420 would retain a higher-low from last week’s 5400 test and that would keep bulls in order for a larger push.
That’s what’s happened so far and prior resistance at 5500 or 5600 have been unable to slow down the drive. At this point, price has pushed back in the prior range, the same that was set up ahead of the September sell-off. I’m tracking this from 5600 to 5664-5670.
S&P 500 Futures – Daily Chart
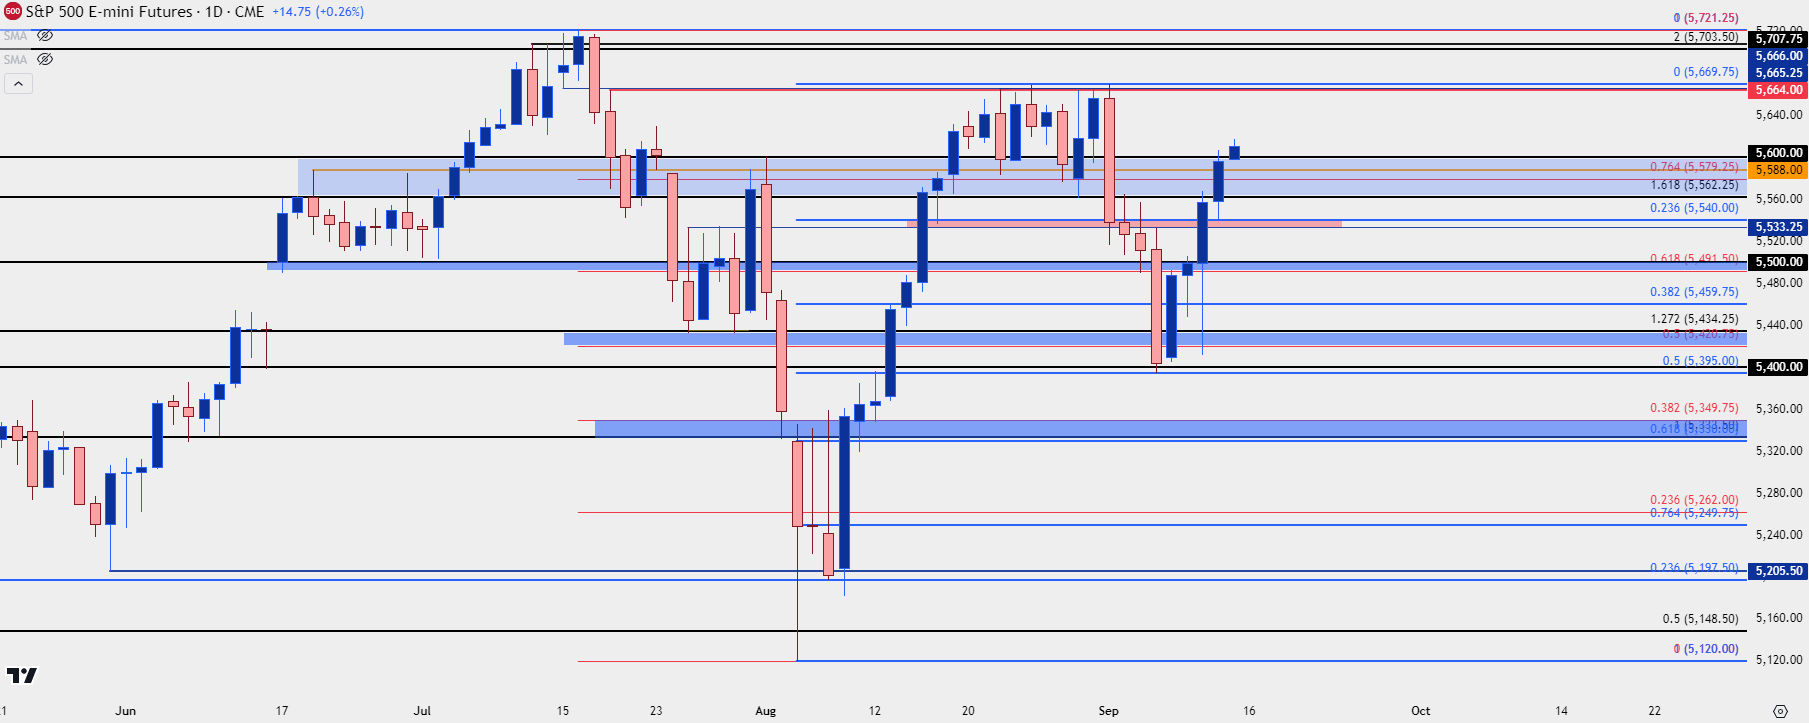 Chart prepared by James Stanley; data derived from Tradingview
S&P 500 Shorter-Term
While bulls have made a showing on the daily chart, there’s also been shorter-term gyration at some important levels. Shortly after publishing yesterday’s S&P 500 article, the first level of identified support came into play at the 5533.25-5540 zone, which held. That led into a strong push which broke-above the 5600 level. And then another pullback appeared, with price dropping down for a test of 5580 which similarly held as bulls jumped back-in.
The challenge at this point is chasing a stretched market in what was previously a contentious area on the chart. The 5600-5670 range was in-play for a couple of weeks and I’m hard pressed to be excited about any levels within that range. There’s also been no sign yet that bulls are willing to let up, although logically there could be a bit of pullback given how quickly the move has priced-in.
So while there could be opening scope for pullback, the potential for that to take on the tone of a reversal is a gigantic question mark, especially with the FOMC rate decision around-the-corner.
For supports, there’s quite a bit of structure in-play. The 5600 level has already exhibited some shorter-term support and below that, the 5588 would be an aggressive showing if buyers can hold that as higher-low support. I would still consider bullish potential from 5580 given the touch-and-go move from yesterday, and there’s even a case for 5562.25.
I think it would take a push below the 5540 swing-low from yesterday to start opening the door for bearish scenarios, which would then open the door to a longer-term zone that had set resistance on Tuesday and again on Wednesday morning, at the 5491.50-5500 zone.
Supports:
S1: 5588
S2: 5562.26
S3: 5533.25-5540
S4: 5491.50-5500
Resistance:
R1: 5638
R2: 5664-5670
R3: 5700-5721.25
S&P 500 Four-Hour Price Chart
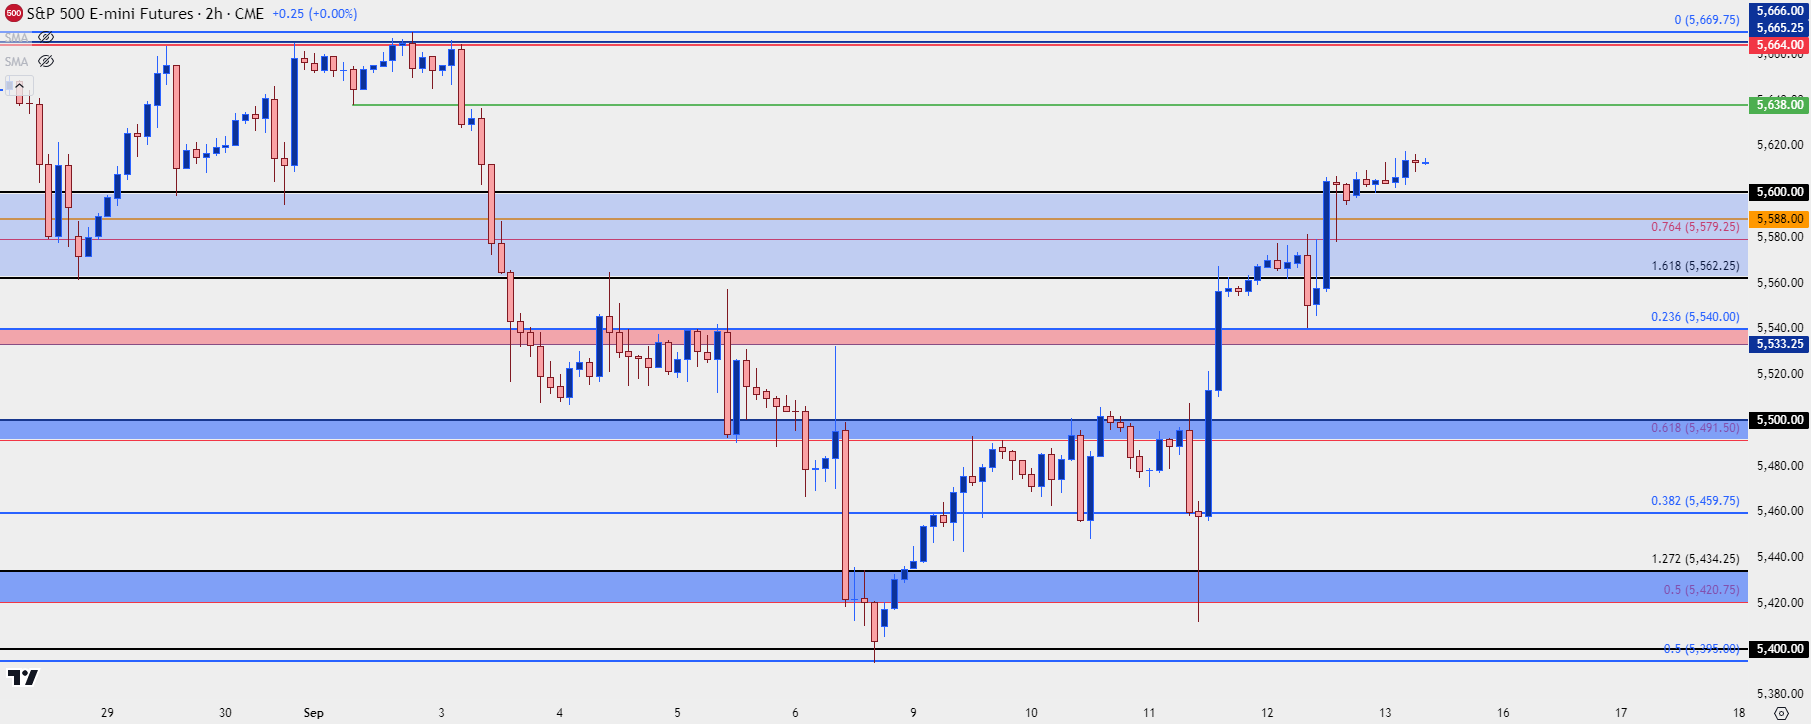 Chart prepared by James Stanley; data derived from Tradingview
--- written by James Stanley, Senior Strategist
Latest market news
September 18, 2025 02:48 PM
June 23, 2025 01:22 PM
June 23, 2025 10:39 AM
June 20, 2025 05:23 PM
June 20, 2025 04:46 PM
June 20, 2025 03:35 PM

February 10, 2025 08:45 PM

February 1, 2025 02:00 AM

January 1, 2025 07:30 AM

December 23, 2024 02:45 PM