

S&P 500 Talking Points:
- It was just a few weeks ago that some pundits were calling for a ‘Black Monday’ in stocks after Chair Powell refused to talk up the Fed put. But that Monday ended up showing the low for the month as a strong recovery move has taken over.
- Ahead of that bounce, SPX had pushed into oversold territory on the weekly chart for the first time since March of 2020. The response to that, so far, has been strong.
- A calming of tariff tensions has been a big part of the rally, but traders should be careful trying to predict the actions of President Trump. Instead, I look at strategy on the basis of levels in the analysis below.

Data is back in the headlines for next week even though it’s been fiscal and trade policy stealing the spotlight for the past couple of months. On Wednesday, we get the release of Core PCE as an indication of inflation and this is often called ‘The Fed’s preferred inflation gauge.’ And then on Friday, Non-farm Payrolls is released, and this will give us the next glimpse into the jobs market. At this point it seems that many on the Fed are still cautious of tariff impact on inflation so if we do see stronger inflationary readings via Core PCE or Average Hourly Earnings in the NFP report, bears could get some ammo to make another push lower. But with that said, buyers have very much been in control of price action over the past few weeks and until there’s evidence of change there, I’m going to default to that side.
In S&P 500 futures, there’s a long-term Fibonacci retracement that remains notable. This is simply the 2022-2025 major move, and the 50% marker of that move is what held support a few weeks ago at 4834.
Since then, it’s the 23.6% retracement that’s held multiple episodes of resistance at 5537. And the 38.2% retracement of that move is notable, as well, as it held last week’s low on top of showing as intra-week support two weeks ago, holding the lows after the massive 10% rally on April 9th when President Trump walked back tariffs on everyone but China.
S&P 500 Futures Weekly Chart
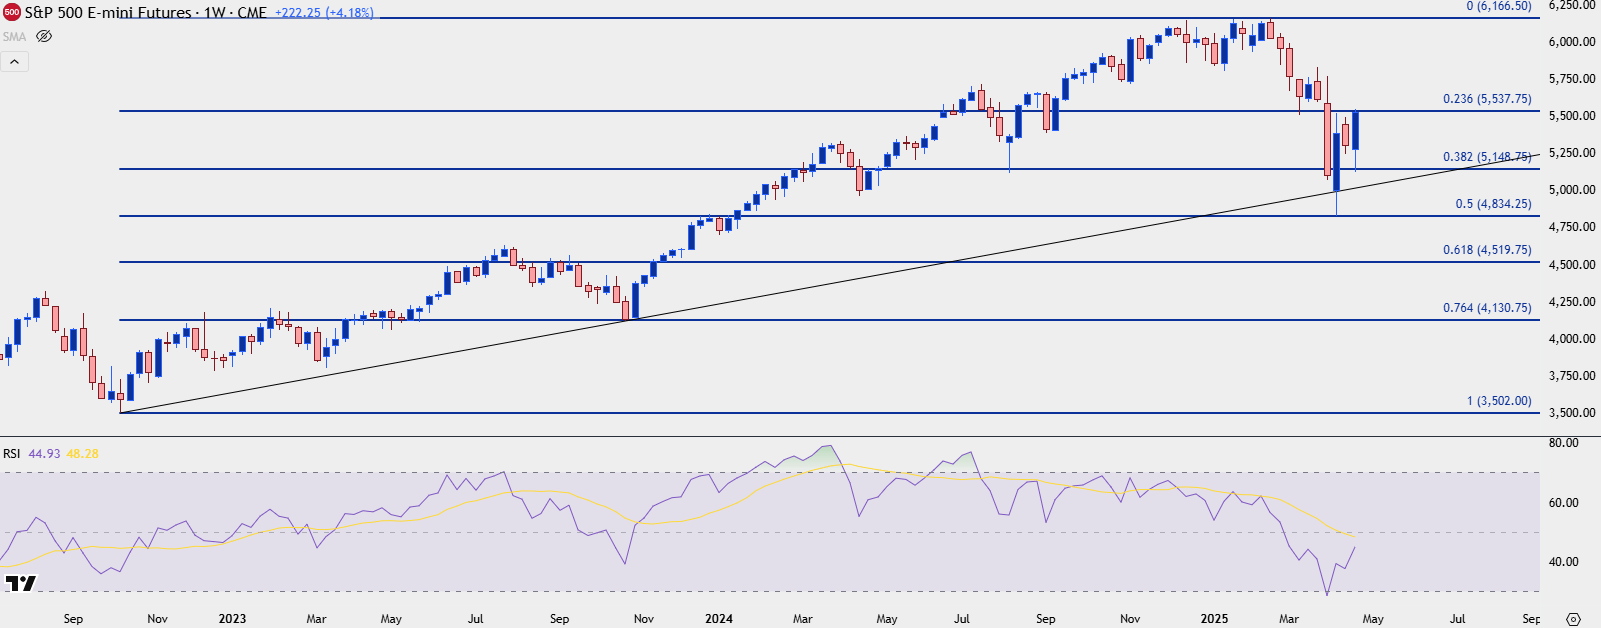 Chart prepared by James Stanley; data derived from Tradingview
S&P 500 From Gap to Gap
On a shorter-term basis there’s another Fibonacci retracement of note and that’s drawn on the sell-off that spanned from the February highs to the April lows. I’ve drawn that in red on the chart below. Also of interest are a couple of gaps that I think remain key into next week, with the gap produced by the ‘Liberation Day’ announcement on April 2nd looming overhead, and a gap from last week sitting underneath as support. There’s confluence with both zones and Fibonacci levels from those two retracements, as the 5537 level that held the highs this week showing very near the bottom of the gap sitting atop price. And the 5431 level, which is the 38.2% retracement of the pullback sits in the middle of the gap below price, which remains unfilled, at this point.
Given the context this has been an impressive recovery as there’s still no acknowledgement of a Fed put, which is what differentiates the current backdrop from most of the past 16 years since the Global Financial Collapse. While the Fed was loose and passive with surging inflation in 2021, calling it ‘transitory’ and ‘supply chain related,’ actual lower inflation hasn’t been enough to move the bank closer to rate cuts as the simple prospect of an inflationary impact from tariffs has caused them to suddenly be prudent and somewhat hawkish.
This hasn’t stopped Governors Waller or Collins from opining on the matter, with both sounding more dovish than Goolsbee or Powell; but this does put some emphasis on next week’s data as signs of shifting inflation or employment could alter those stances and, in turn, market expectations around near-term rate moves.
Stocks have seemingly stayed strong despite that lack of Fed support, and over the past few weeks, probably the most impactful thing that’s shifted has been President Trump’s tolerance for equity market losses. While stocks were weak in February and March on the prospect of widespread tariffs, punctuated with a massive sell-off in early-April as he unveiled those tariffs, ever since the 4834 test, he’s been considerably more passive on the matter.
Keep in mind it was that Monday when the low came in place when an initial story was floated across social media of a 90-day delay in tariffs. The White House walked that back but a couple days later, on Wednesday, that’s what arrived – and led to the 10% rally in S&P 500 futures. That move has digested in the two weeks since bulls have continued to press as denoted by this week’s higher-high on the heels of last week’s support hold at the 5147 level, which is confluent between both Fibonacci retracements mentioned previously.
For next week – it’s the gaps that remain in-play. For bulls, the completion of the blue gap below from Tuesday of last week sets the stage for support. If we see buyers press breakouts without a pullback to that gap, then it’s the 5656 level that looms large and from that, a pullback and higher-low could set the stage for trend continuation strategies. The current zone of 5500-5537 remains as somewhat messy and thus, a sub-optimal position on the chart from which to substantiate strategy. But – if we do get that stretch higher, the current spot of resistance is a clear area to look for higher-low support to hold.
S&P 500 Futures Daily Chart
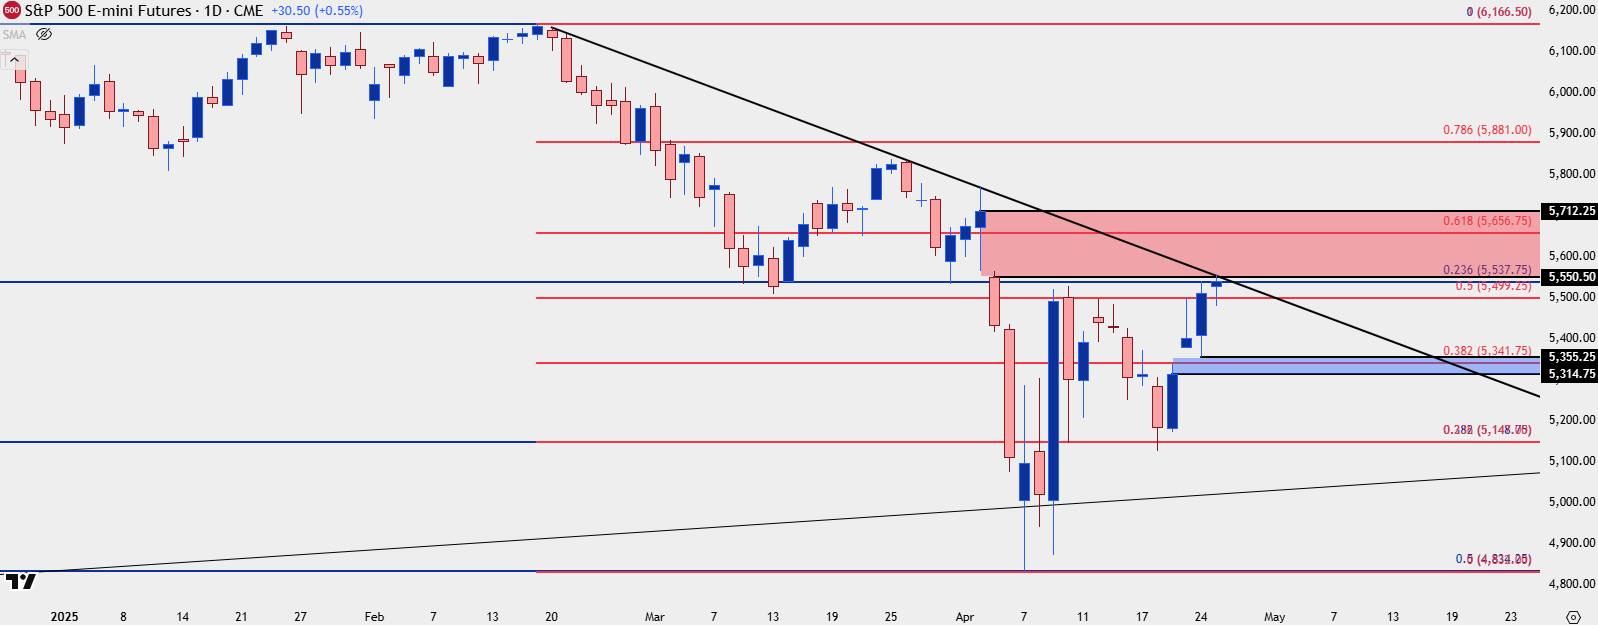 Chart prepared by James Stanley; data derived from Tradingview
--- written by James Stanley, Senior Strategist
Latest market news
Today 10:00 AM
Today 09:09 AM


Yesterday 12:15 PM

June 17, 2025 12:50 PM
June 16, 2025 12:55 PM