

S&P 500 Talking Points:
- The S&P 500 finished its fourth consecutive weekly loss last week, and that’s only the second time for such an occurrence since the 2024 open, with the only other instance taking place last July and August which was then followed by an approximate 14% rally in the index over the next few months.
- Also of note from last week was the first trip below the 200-day moving average for the index since November of 2023. Friday brought a vigorous bounce with the weekly close holding at a major area of interest on the chart at 5638, looked at in the weekend forecast and explained further below.
- The big item on the economic calendar for this week is the FOMC rate decision on Wednesday, and I’ll be previewing that event in the weekly webinar on Tuesday. Click here for registration information.

It’s been a rough past month for the S&P 500, as the index has seen losses on the weekly chart for four consecutive weeks. That’s not a very common occurrence, particularly over the past couple of years, and the last time that happened was August of last year, right around when the low had set in the second half of 2024.
Interestingly, the same zone of resistance that’s in-play right now was what had turned around the index back then, with the 61.8% Fibonacci extension of the 2022 sell-off marking the high. That resistance led to three consecutive sell-offs on the weekly, followed by a massive gap down for week four that then saw bulls make a return; although they weren’t quite able to close that week above the prior weekly close which is what allowed four the fourth consecutive weekly loss.
But bulls showed back up in a big way, thereafter, rallying stocks for almost 14% over the next few months, through the U.S. Presidential Election.
S&P 500 Weekly Chart
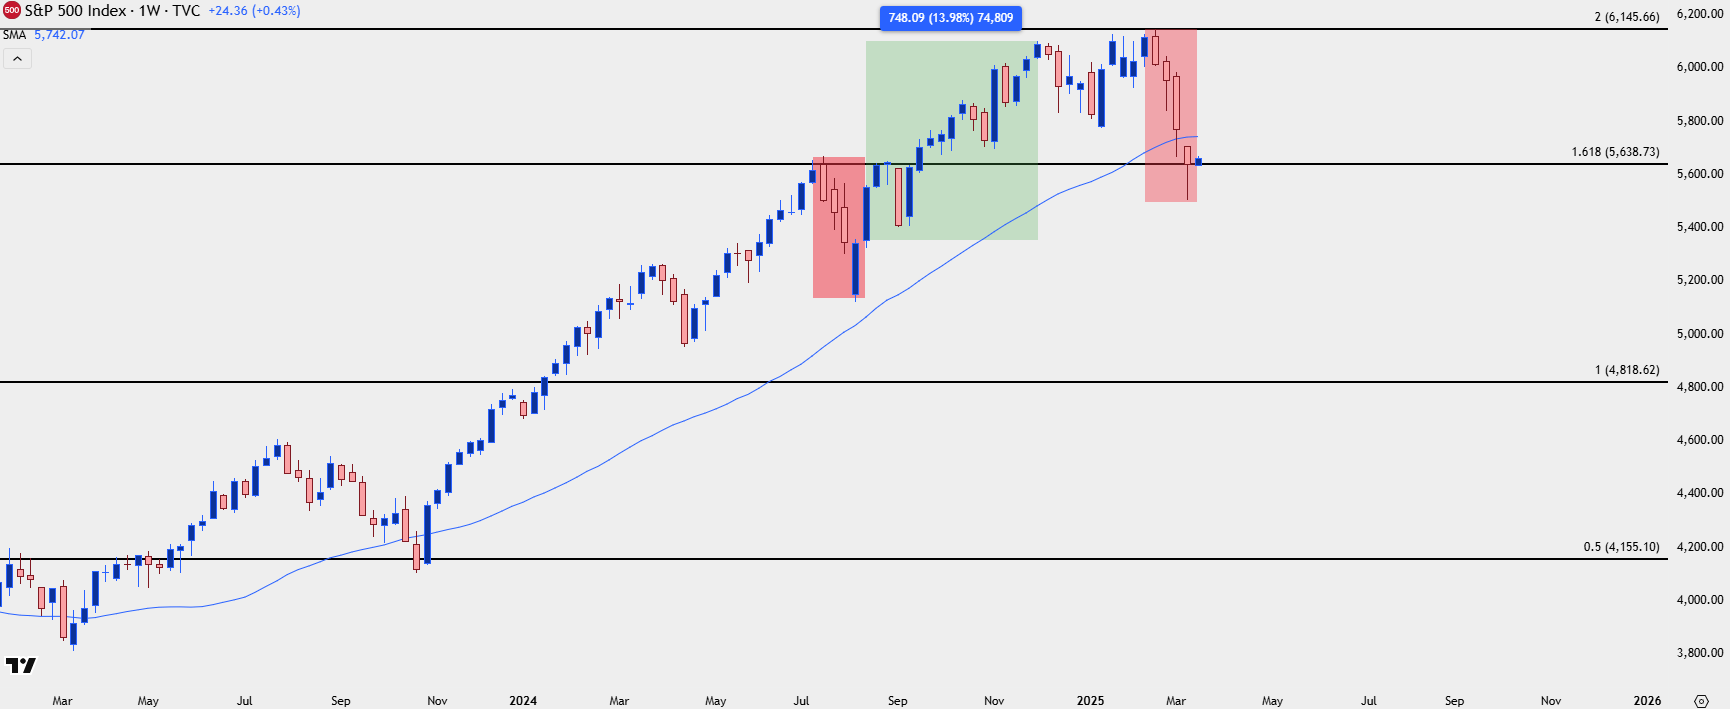 Chart prepared by James Stanley; data derived from Tradingview
S&P 500 Shorter-Term
SPX has fallen by as much as 10.46% from the February highs that were set less than a month ago, so it’s perhaps the speed with which this pullback has appeared that’s been most surprising. But perhaps the larger question is whether the momentum feeds itself, further incentivizing selling from both longs and opening shorts.
The combination of factors contributing to the indexes decline can make for a challenging backdrop for bears, and something like this could have an impact this week as we hear from the Federal Reserve with an updated Summary of Economic Projections.
Last week saw the index slip below it’s 200-day moving average for the first time since Q4 of 2023. That episode was brief, however, lasting a little longer than a week and followed quickly by the return of bulls as stocks ramped for the next few months, and continued ramping until July when that prior streak of four consecutive weekly losses appeared.
Also of interest is the RSI indicator, which went oversold on the daily chart for the first time Q4 of 2023, along with the last instance of a trip below the 200dma and right around the October low.
The Friday rally in SPX helped the indicator to recover out of oversold territory. And, notably, that prior instance of oversold RSI was a second show as RSI divergence had begun to appear from the prior instance. Which begs the question as to whether we may be lining up for something similar over the next week with the Fed taking center stage.
For bears that are looking for a chance to take a bearish stance on the index, there’s a couple of key spots sitting overhead. The prior weekly close at 5770 has some remaining unfilled gap, and that’s nearing confluence with the 200-day moving average that plots 30 points lower. On a shorter-term basis which I’ll look at below, 5670 is of interest as this is the top of the support zone I had discussed in this weekend’s technical forecast.
SPX Daily Chart
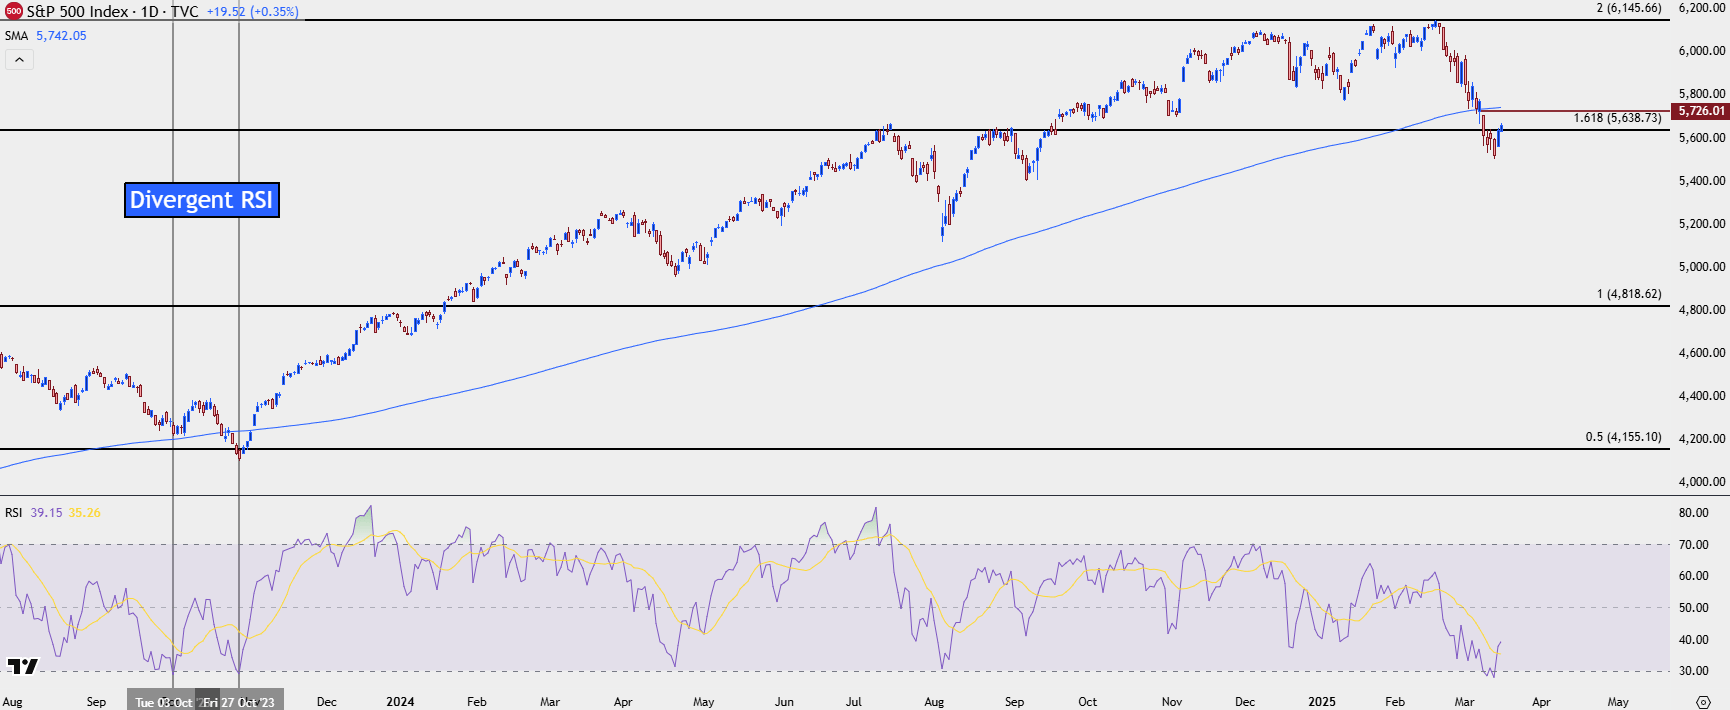 Chart prepared by James Stanley; data derived from Tradingview
S&P 500 Daily Chart
There’ve been numerous bearish short-term twists over the past couple of years and each time, the Fed has helped to prod support into the matter. Given an FOMC rate decision on the calendar for this week along with updated projections at this quarterly meeting, it would seem that the bank has ample opportunity to do something similar here. This brings to question the ‘Fed put’ narrative and whether we’ll hear Jerome Powell talk up the prospect of softer policy and accommodation later in the year, or whether he’ll take a more hardline stance on the matter.
At this point the index has recovered just about 23.6% of the recent sell-off, and the 38.2% retracement of that move is confluent with the 200-day moving average, so that would present another spot of possible resistance. If prices can punch up to that level, however, there would also be an opening door for recovery themes – provided that the 5638-5670 zone could hold higher-low supports; and that would open the door for a move up to 5824 which is the 50% mark of the recent sell-off.
For bears, the next major area of longer-term support on the chart is the 5340-5402 zone that I had looked at as my ‘s3’ zone in the 2025 forecast for indices.
SPX Four-Hour Chart
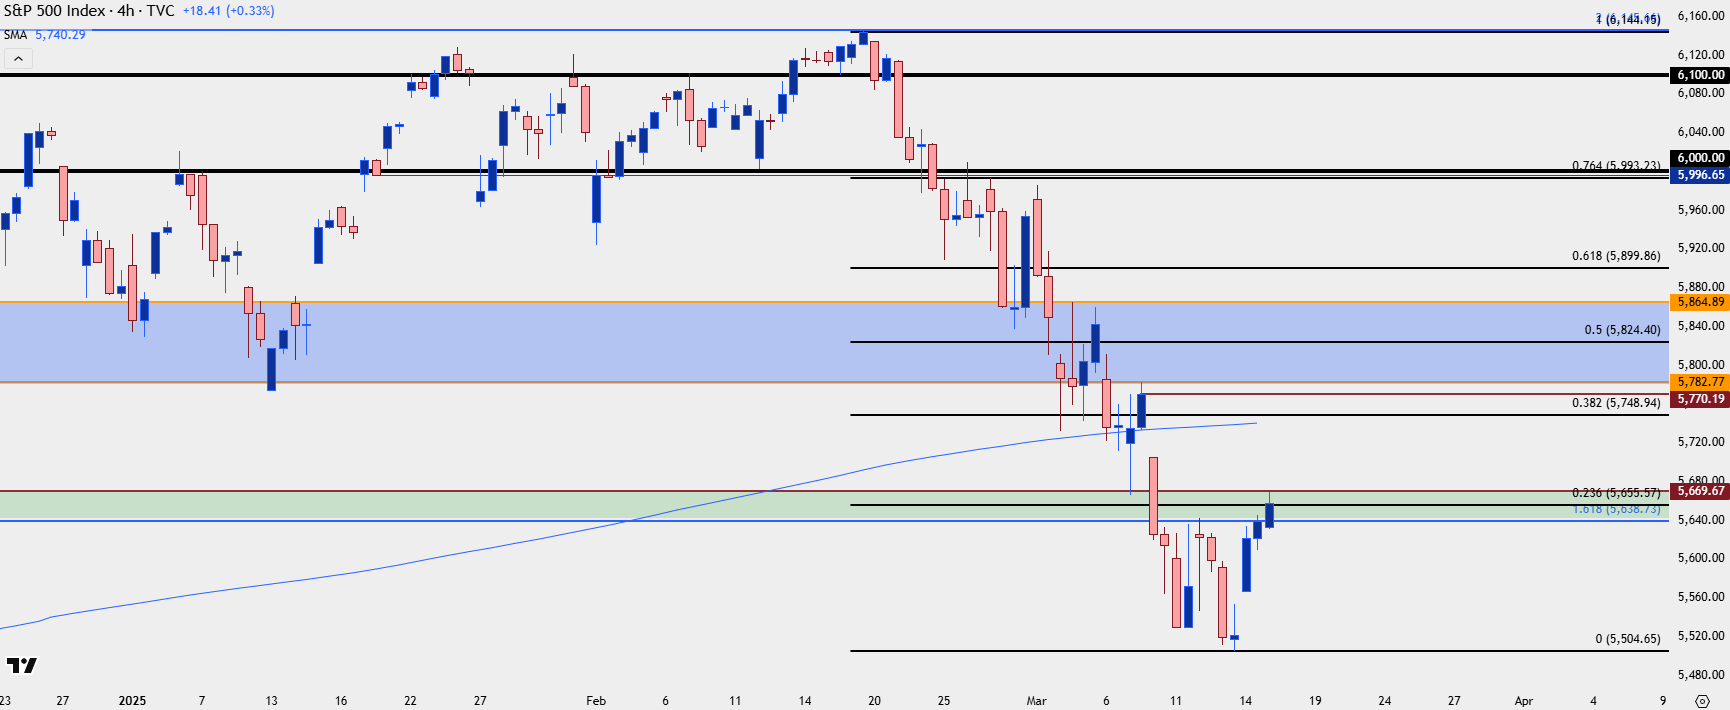 Chart prepared by James Stanley; data derived from Tradingview
--- written by James Stanley, Senior Strategist
Latest market news
September 18, 2025 02:48 PM
June 23, 2025 01:22 PM
June 23, 2025 10:39 AM
June 20, 2025 05:23 PM
June 20, 2025 04:46 PM
June 20, 2025 03:35 PM

June 9, 2025 03:52 PM

June 6, 2025 05:41 PM

May 21, 2025 07:02 PM

May 20, 2025 06:58 PM