

S&P 500, Nasdaq 100 Talking Points:
- I had looked into the S&P 500 yesterday as sellers were driving just after the release of US CPI. At the time, the 5420 level was in-play and as I had written, that was a spot with which bulls could defend to allow for a higher-low. That happened, and buyers then drove a consistent trend for the rest of the session.
- The Nasdaq also rallied and at this point is testing trendline resistance. As I had shared a couple weeks ago, the Nasdaq leading US equities lower was not a bullish factor, and that led into last week’s sell-off. But after an exuberant rally many headlines have taken on an extreme-bullish tone.

In yesterday’s article, stocks were selling off at the time of publication following the CPI report. But, as I had written, there was support structure in-play and a hold around the 5420 level in S&P 500 Futures kept the door open for a higher-low.
That support showed shortly after the article was released and buyers took over after, leading to a massive one-day rally and a visible turn on the daily chart. The 5500 level that had previously foiled their efforts now becomes key support, and current resistance is showing in a familiar area, spanning from 5562-5600.
S&P 500 Daily Price Chart
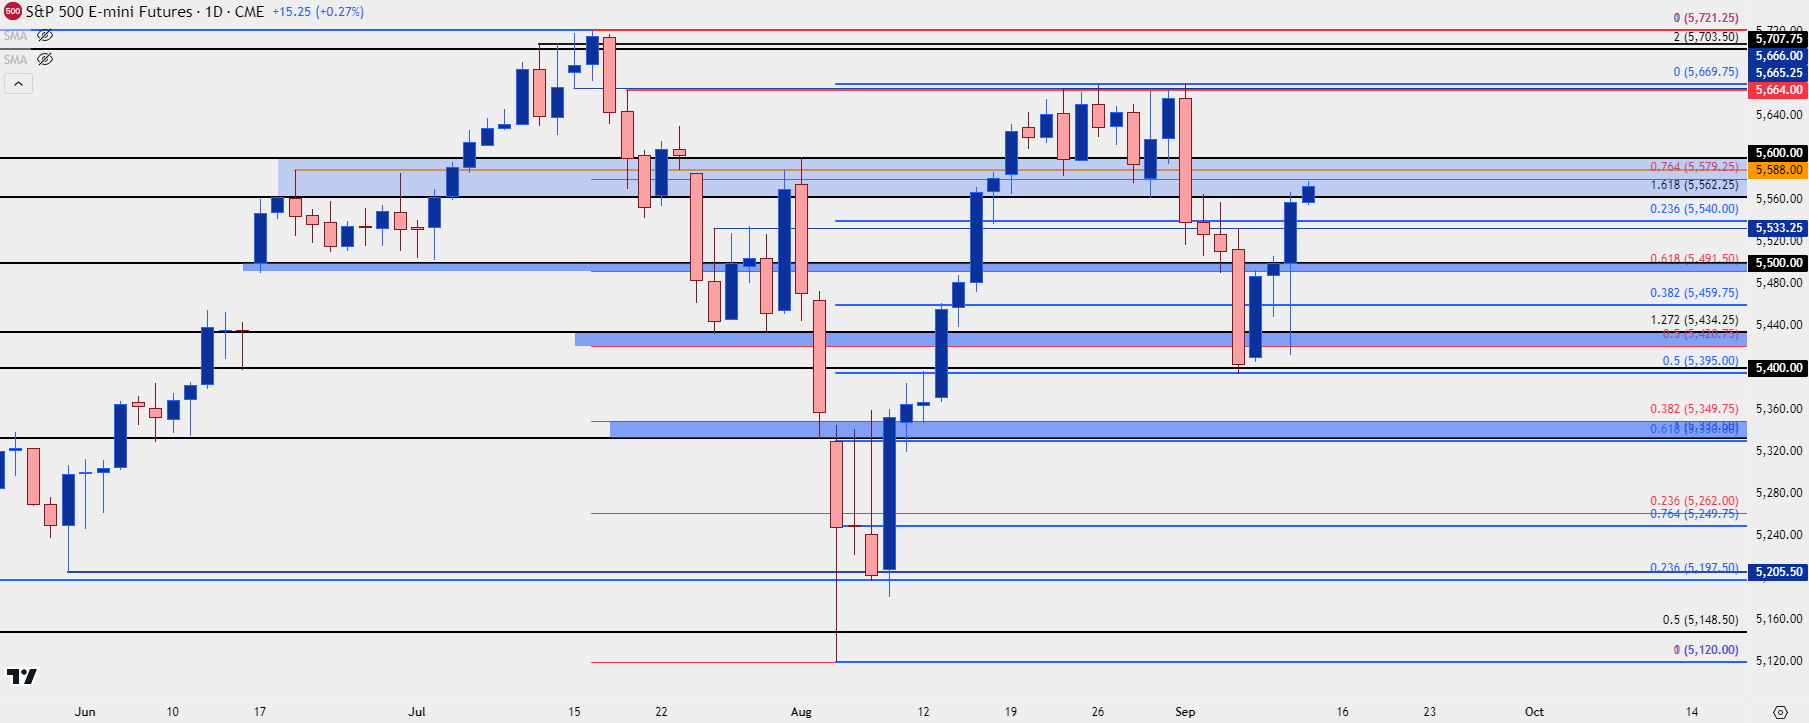 Chart prepared by James Stanley; data derived from Tradingview
S&P 500 Levels
The current zone of resistance is a big one as this was support in the August range. That range broke early last week, leading to a sizable sell-off that held through last week’s close. But given the pace of the rally from yesterday bulls now have an open door to test above that. I’m tracking levels at 5580, 5588 and then 5600.
Logically, some pullback potential could show after such a strong move and there’s a couple of spots of interest for support. On a short-term basis, 5562.25 has already come into play and below that, a zone from 5533.25-5540. Below that is a key zone, and resistance from Tuesday that had a strong reaction yesterday around CPI and that’s the 5491.50-5500 zone. If sellers can push below in the next two days the rally from yesterday will very much be in question.
S&P 500 Four-Hour Chart
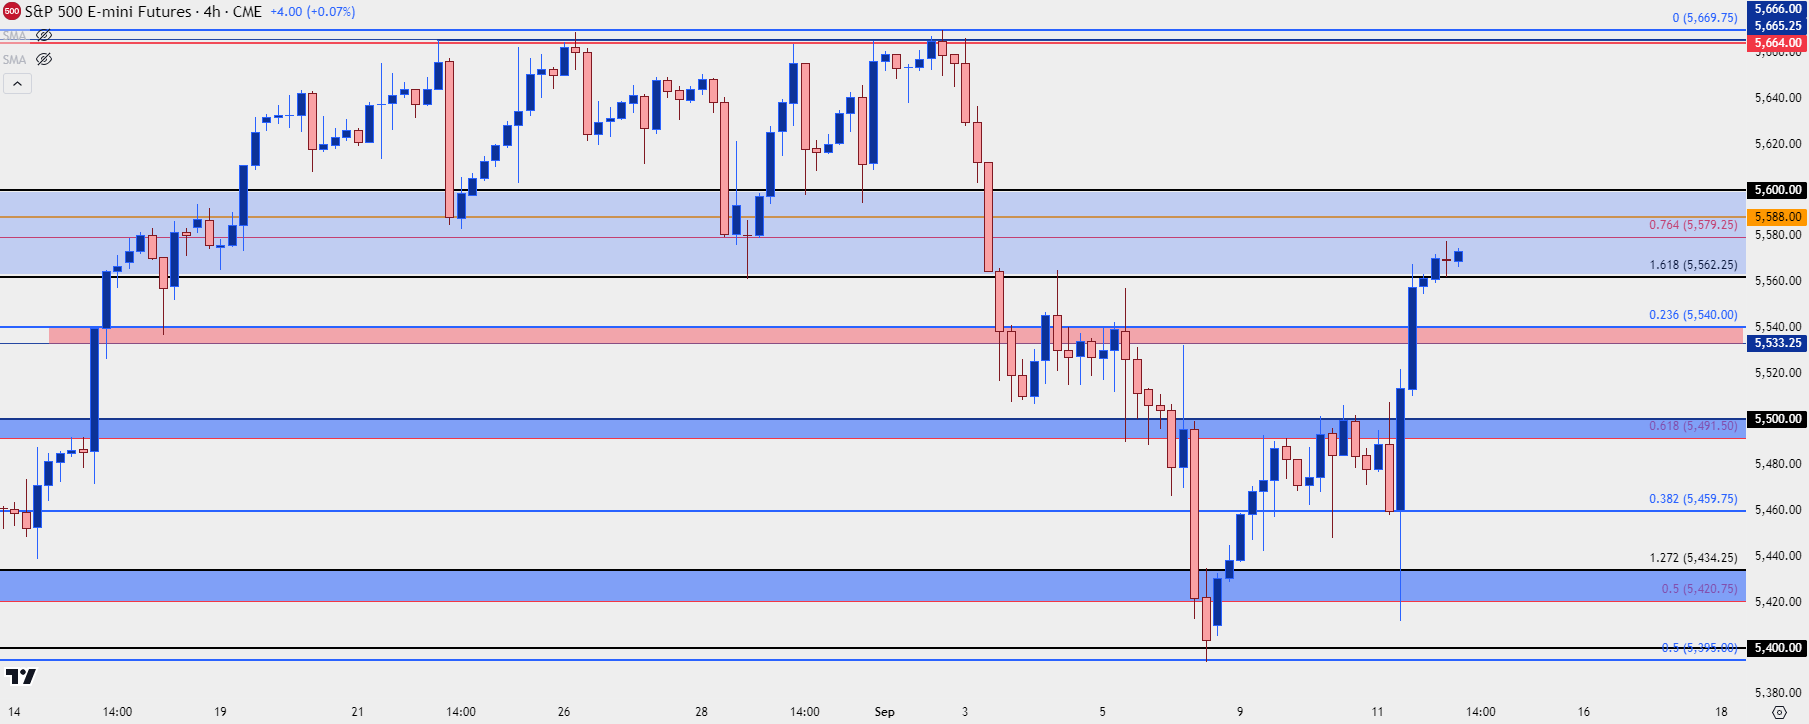 Chart prepared by James Stanley; data derived from Tradingview
Nasdaq 100
What is perhaps more interesting here is the tech-heavy Nasdaq 100. The index stumbled after a failed test at 20k and sellers very much had their way in the first week of September. With headlines now tilting bullish, and extreme-bullish in some cases after the size of yesterday’s rally, tracking continuation here becomes an important variable.
At this point, I have the Nasdaq 100 testing trendline resistance, taken from August and early-September swing-highs. Above that, resistance potential comes from a prior spot of support, plotted at 19,377 with a larger zone overhead from 19,596-19,728. And of course, 20k looms large over that zone.
For support, a pullback to and hold of the 19,146-19,167.50 area would keep bulls in order. If they fail to hold that, then 19k remains of interest. But if sellers can sink price below that level the door opens for a re-test of the 18,506-18,738.75 zone that’s already seen considerable activity so far this year.
Nasdaq 100 Four-Hour Price Chart
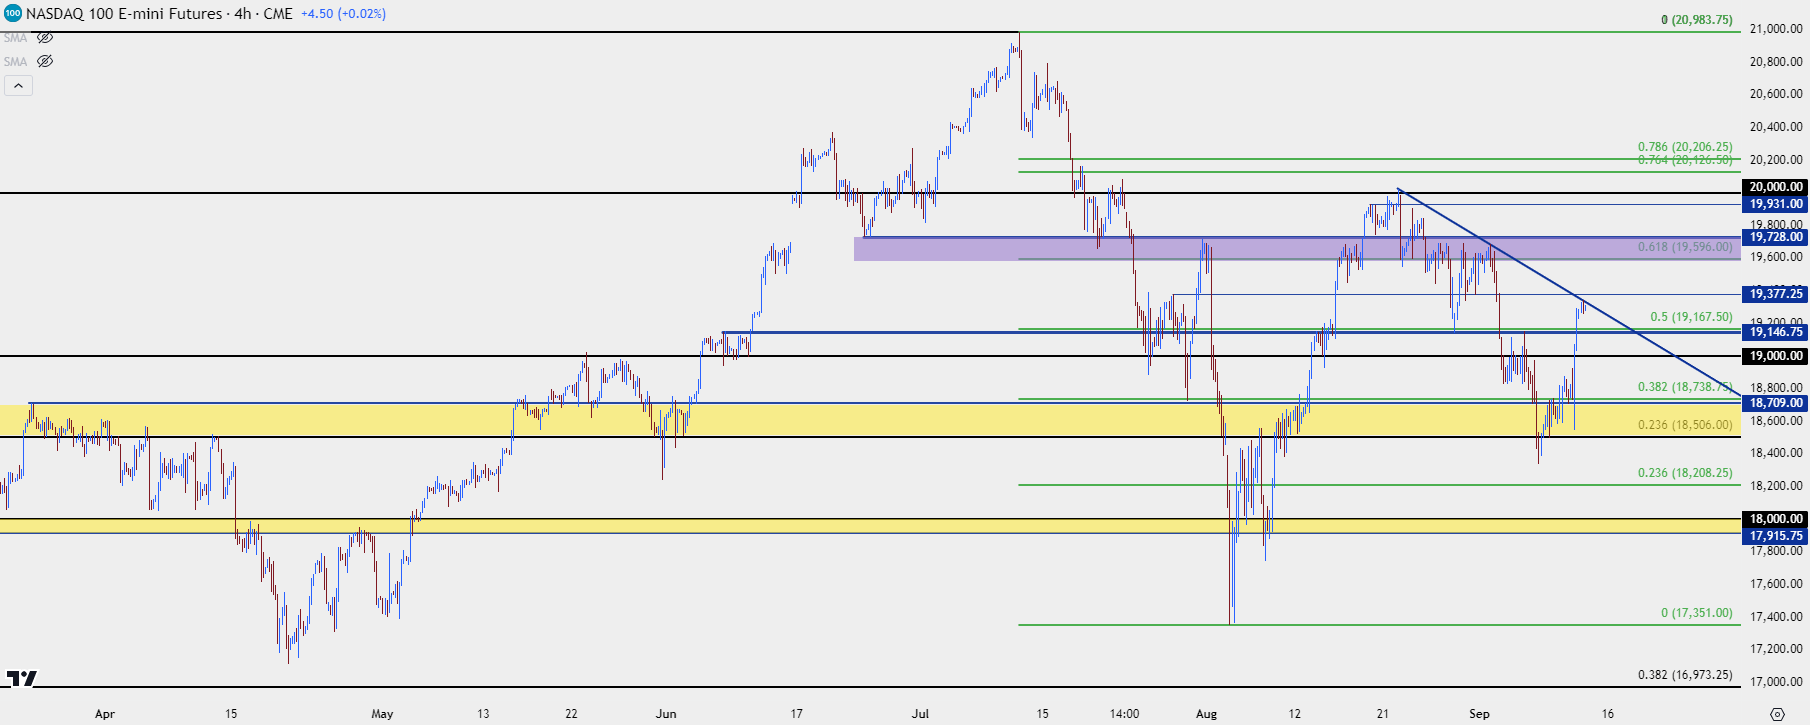 Chart prepared by James Stanley; data derived from Tradingview
--- written by James Stanley, Senior Strategist
Latest market news
September 18, 2025 02:48 PM
June 23, 2025 01:22 PM
June 23, 2025 10:39 AM
June 20, 2025 05:23 PM
June 20, 2025 04:46 PM
June 20, 2025 03:35 PM

June 9, 2025 03:52 PM

June 6, 2025 05:41 PM

May 21, 2025 07:02 PM

May 20, 2025 06:58 PM