

S&P 500 Talking Points:
- Continuous feeds for ES have rolled over this morning, meaning the ES1! feed that I noramally look at in these articles has shifted from the September to the December contract.
- The September contract settles on Friday and given the dynamics between the two I’m going to focus on September in this article, with expectation to go back to the ES1! feed later this week or at the start of next week.
- I’ll be looking into these setups in the Tuesday webinar and you’re welcome to join, click here for registration information.

If you look at ES1! this morning, it’ll look like the e-mini S&P 500 has hit a fresh all-time-high. But that would be misleading as a look at the cash index of SPX shows that not to be the case. This often provides confusion for newer traders or traders that are new to futures markets and with an FOMC rate decision on the table for tomorrow, the technicalities of technical analysis are of the upmost importance. So, for today’s article I’m going to look at the index from the perspective of the September contract, which settles on the 20th of this month (Friday).
But, first, I want to highlight these differences and hopefully this can serve as a form of reference and there could be some forward-looking dynamics of interest.
As example, the last time the ES contract rolled was in June and this created a sizable gap on the chart. I’ve highlighted this in a green box on the below chart. Prices ranged for a couple of weeks after the gap and, eventually, stocks pushed up to what was at the time a fresh all-time-high. But it was around mid-July that reversion reared its head and when that happened, the prior gap high came in as a key point of support, leading to a sizable bounce (highlighted with an orange box at that low).
So, the levels that have been in-play through the gap can remain of interest and this is something that will be tracked with future price action.
ES1! Daily Price Chart
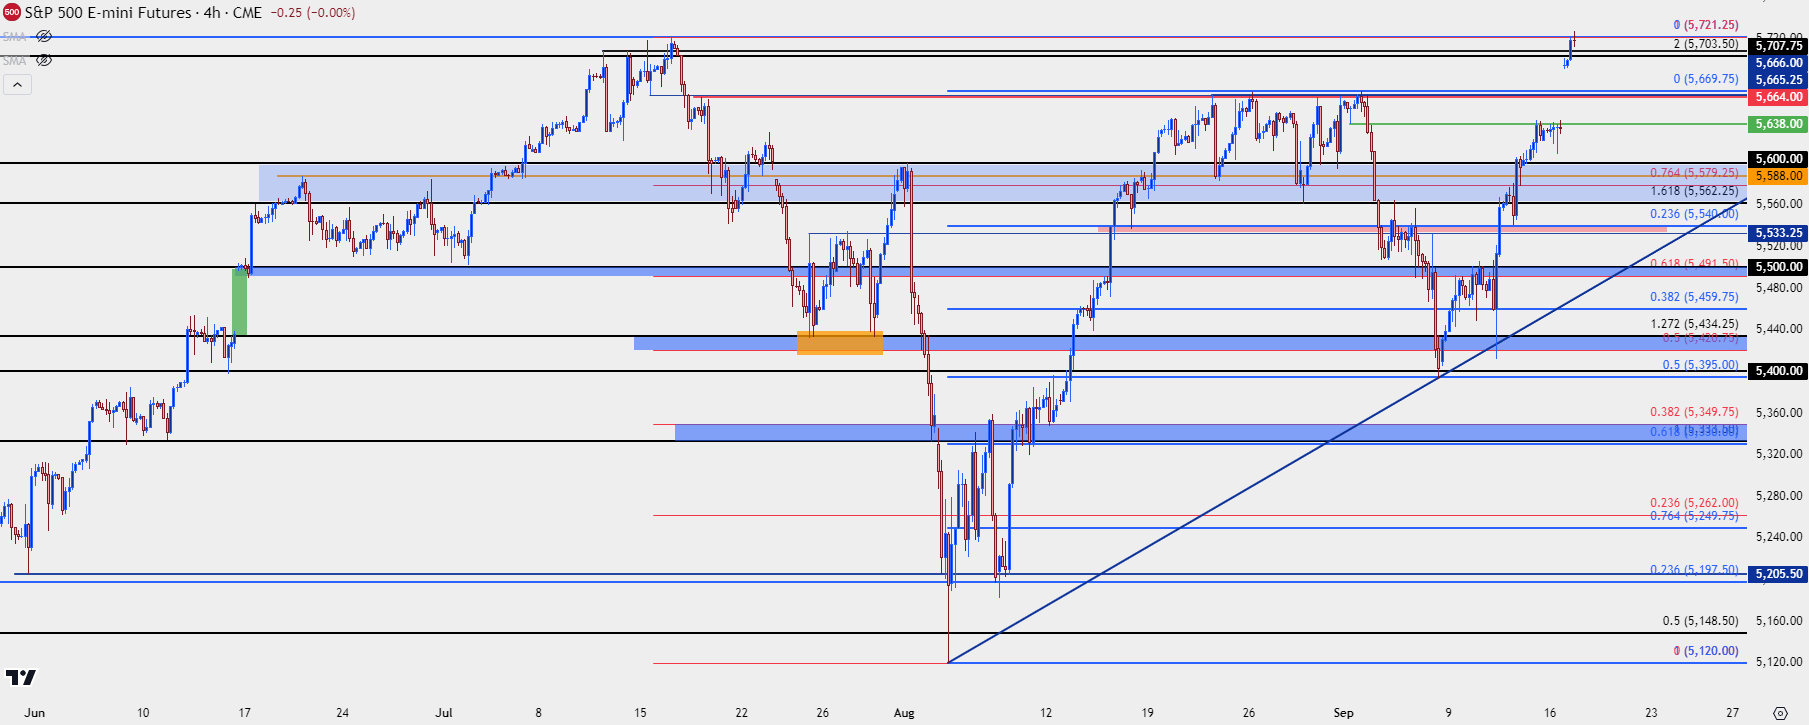 Chart prepared by James Stanley; data derived from Tradingview
ES – September
While the above chart indicates a fresh all-time-high, that seems a bit misleading and the below chart focusing on just the September contract will provide a bit of reference. While ES did make a fresh ATH in July, the below contract was the active market for the ES1! price feed. That built into a lower-high with the August bounce, with sellers holding resistance around the 5650-5665 zone.
The sell-off from that lower-high ran down to the prior week’s close of 5,400, after which bulls made a statement last week on the heels of CPI. I had looked at higher-low potential of 5420 at the time and we can see that Wednesday pivot showing visibly on the below chart.
But at this point, we’re seeing resistance hold at the same area of resistance from August, around the 5650-5665 zone. This also provides a bit of structure for support, as the 5638 level that was resistance on Friday and Monday is now a spot for a possible higher-low, should bulls remain aggressive enough to defend that spot. Below that, another spot of prior resistance-turned-support shows around 5609, which is then followed by the 76.4% Fibonacci retracement of the July-August pullback at 5579.25. Interestingly, that spot was also an area of prior resistance-turned-support.
This would be the structure that bulls need to defend to retain control.
On the resistance side of the matter, it’s clear above 5665 which is highlighting the 5700 level, followed by the ATH set in July at 5721.50.
ES September – Daily Price Chart
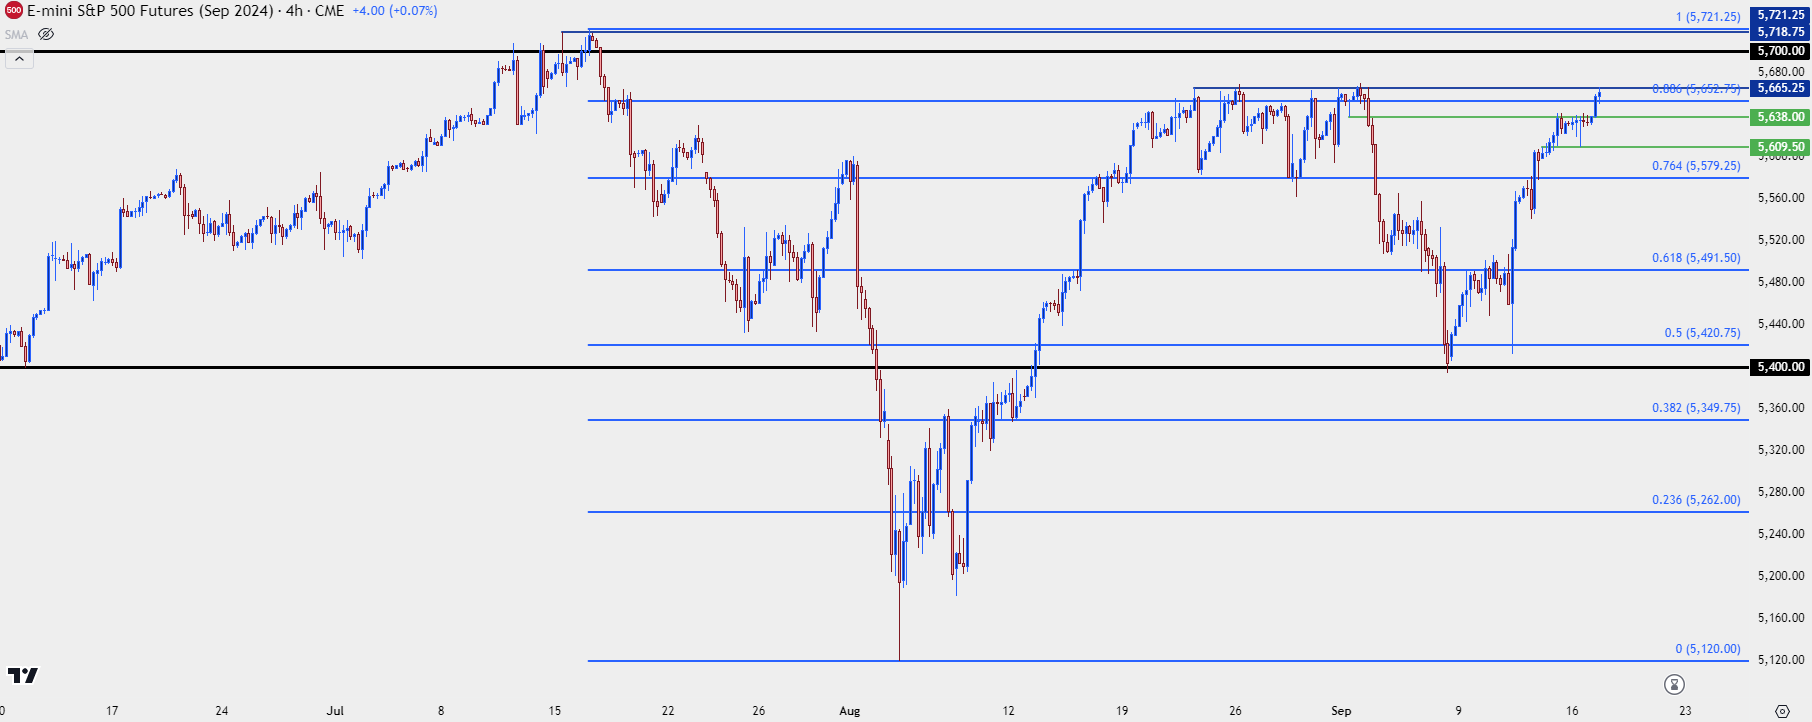 Chart prepared by James Stanley; data derived from Tradingview
--- written by James Stanley, Senior Strategist
Latest market news
September 18, 2025 02:48 PM
June 23, 2025 01:22 PM
June 23, 2025 10:39 AM
June 20, 2025 05:23 PM
June 20, 2025 04:46 PM
June 20, 2025 03:35 PM

June 9, 2025 10:32 PM

April 7, 2025 03:32 AM

April 3, 2025 03:23 AM

January 15, 2025 10:26 PM