

S&P 500 Talking Points:
- Stocks were hammered into the end of last week but so far this week, a different tone has started to show.
- CPI data is on the docket for tomorrow and the Fed is in blackout ahead of their widely-expected rate cut. The debate over 25 or 50 bps continues on as we near next week’s rate decision.
- I’ll be looking into these setups in the Tuesday webinar and you’re welcome to join, click here for registration information.

I was on vacation last week but bears were not, as the S&P 500 held the same resistance that was in-play the week before as sellers took a massive swing. In my final article ahead of that holiday I had highlighted the fact that the rotation we had started to see, with the Nasdaq lagging while the Dow led the way higher wasn’t necessarily a positive fact for bulls.
I had also shared a series of levels that remain in-play today. The 5400 psychological level is what helped to hold the low at last week’s close in S&P 500 Futures, and the 5491-5500 zone of prior support came into play as resistance yesterday, which remains in-play today. The former level is the 61.8% Fibonacci retracement of the pullback that started in July and the 50% marker of that move plots at 5420, which could serve as a form of higher-low if it does come into play followed by a support response.
S&P 500 Daily Price Chart
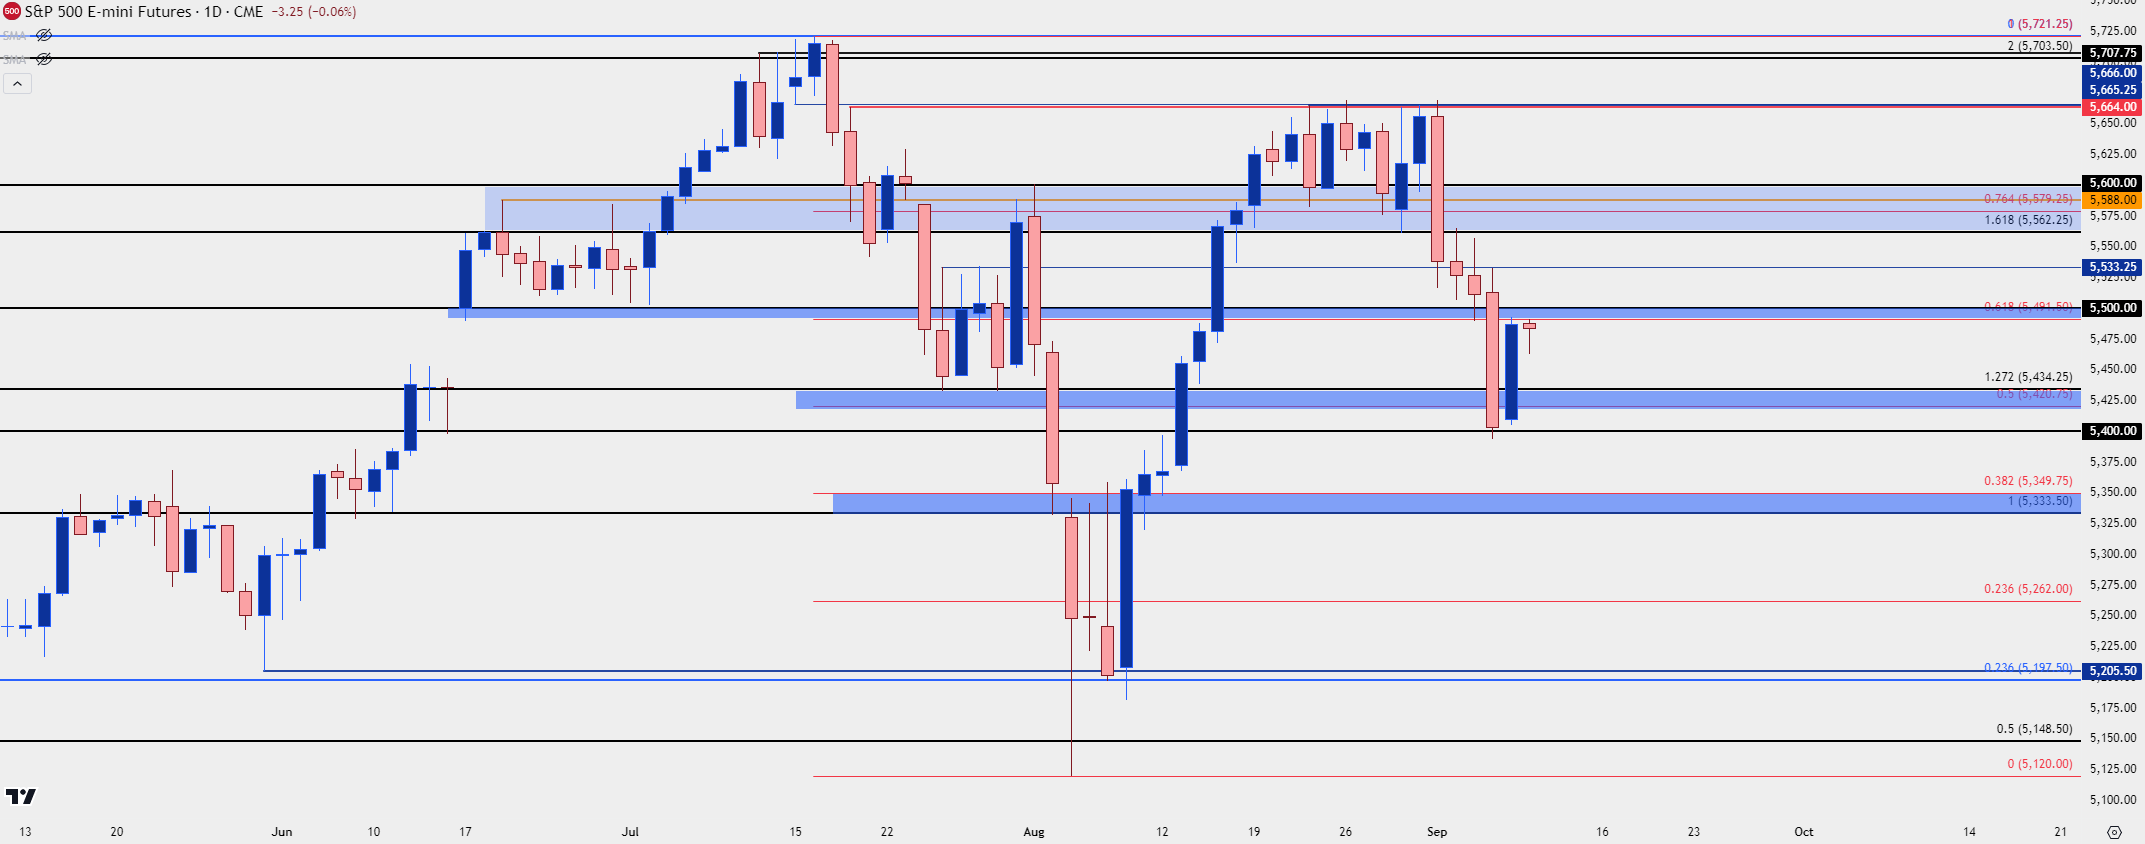 Chart prepared by James Stanley; data derived from Tradingview
S&P 500 Shorter-Term
The 5491.50 level held the highs both during yesterday’s session and then again in the evening after futures resumed trading, but the pullback from that has been rather shallow and buyers look prepared for another test. The possible higher-low plots at 5462.50 and a hold there keeps the door open for a test of 5500 and if bulls can chew through that, the next level that I’m tracking plots at 5533.25.
Above that is a key zone starting with 5562.25, which was the last lower-high before sellers went for the breakdown move in the middle of last week. I’m also tracking levels at 5580, 5588 and then 5600.
Below current price, if sellers can push through 5462.50 then levels at 5434.25 and 5420.75 come into view, which I’ve spanned into a zone. This would be an interesting scenario if it comes into play as a test there would likely get the headlines to look quite bearish given the drivers on the radar, but a hold of support in that area could constitute a higher-low above the 5400 level that came into play late last week.
Resistance:
R1: 5500
R2: 5533.25
R3: 5562.25
R4: 5600
Support:
S1: 5462.50
S2: 5434.25
S3: 5420.75
S4: 5400
S&P 500 Four-Hour Price Chart
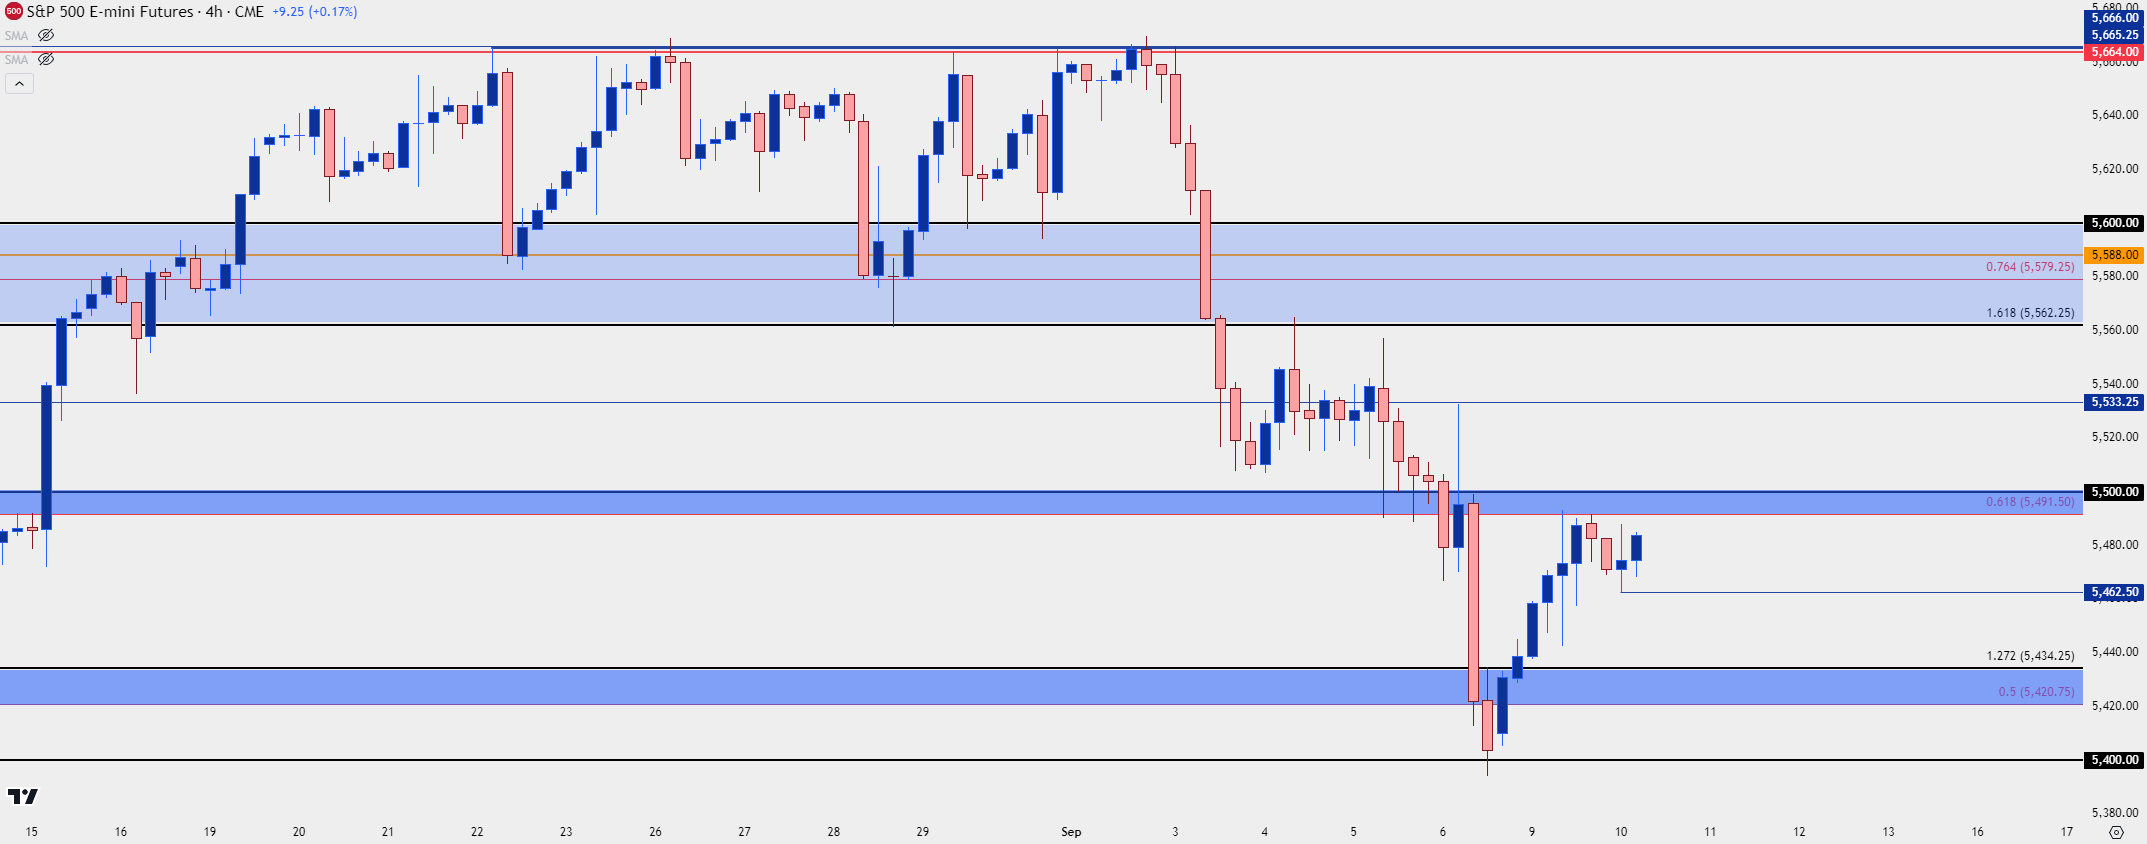 Chart prepared by James Stanley; data derived from Tradingview
--- written by James Stanley, Senior Strategist
Latest market news
September 18, 2025 02:48 PM
June 23, 2025 01:22 PM
June 23, 2025 10:39 AM
June 20, 2025 05:23 PM
June 20, 2025 04:46 PM
June 20, 2025 03:35 PM

June 9, 2025 10:32 PM

April 7, 2025 03:32 AM

April 3, 2025 03:23 AM

January 15, 2025 10:26 PM