

S&P 500 Talking Points:
- This week’s open is far different from last week’s open for the S&P 500, following a strong reversal in the Wednesday morning US session.
- The 5,638 level looked at in Friday’s piece ended up holding the weekly high and so far that’s held another test for the e-mini S&P at the start of this week.
- As I shared in the USD article over the weekend, my expectation is for a 25 bp cut on Wednesday but perhaps even more focus on the Fed’s Summary of Economic Projections, as the bank can use this to highlight a more-dovish outlook for the rest of 2024 and through 2025. I think that will be the pace setter for this week.

It’s Fed week and the FOMC is widely-expected to begin their rate cutting cycle at Wednesday’s meeting. Stocks have been anticipating this for some time, and we can even draw back to Q4 of 2022, when US equities bottomed on the basis of the Fed slowing rate hikes to see when this theme had started. The S&P 500 has been up as more than 38% from those lows with the high that was set in July.
Since then, however, there’s been a bit of stumble. A strong sell-off ensued into the August open and the rally from that held a lower-high, around the 5664 level. And then two weeks ago another sell-off showed, and that tension remained through last week’s open until the Wednesday turn; this is why the 5420 support hold was so important as that set a higher-low in both the intermediate and longer-term themes.
S&P 500 Futures – Daily Price Chart
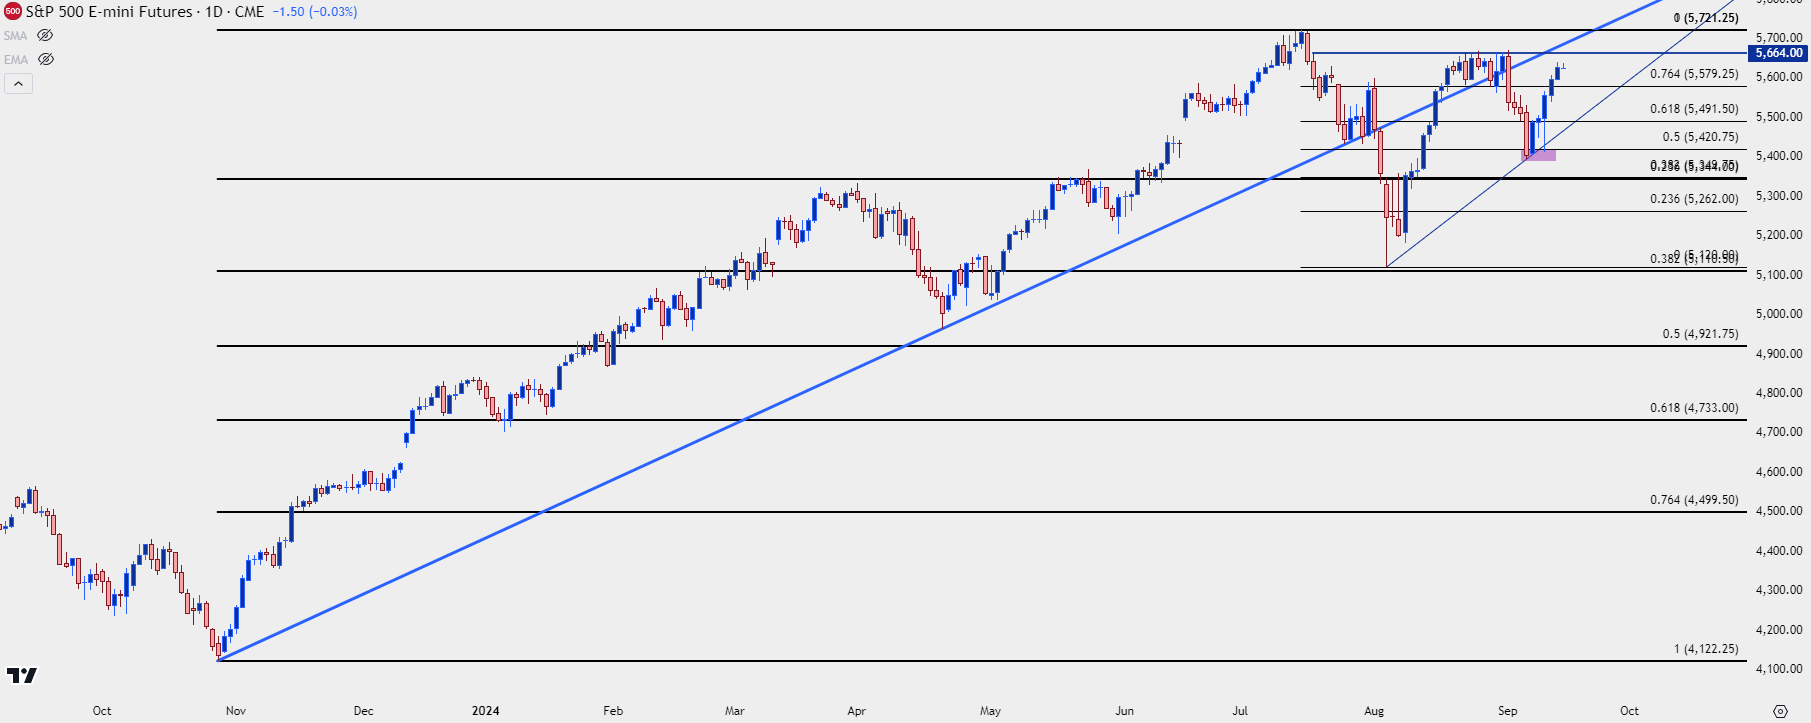 Chart prepared by James Stanley; data derived from Tradingview
Going down to the four-hour we can see just how aggressive that late-week rally was, which put control back into bulls’ hands. Price took out a big zone of resistance around the 5600 level, and the last week’s high ended at the 5638 prior swing-low that I had looked at in Friday morning’s article. The 5580 level also remains of importance as this is the 76.4% Fibonacci retracement of the July-August sell-off. This was also a quick higher-low on Thursday afternoon, after which bulls showed a strong reaction following that test of prior resistance.
S&P 500 Futures – Four-Hour Chart
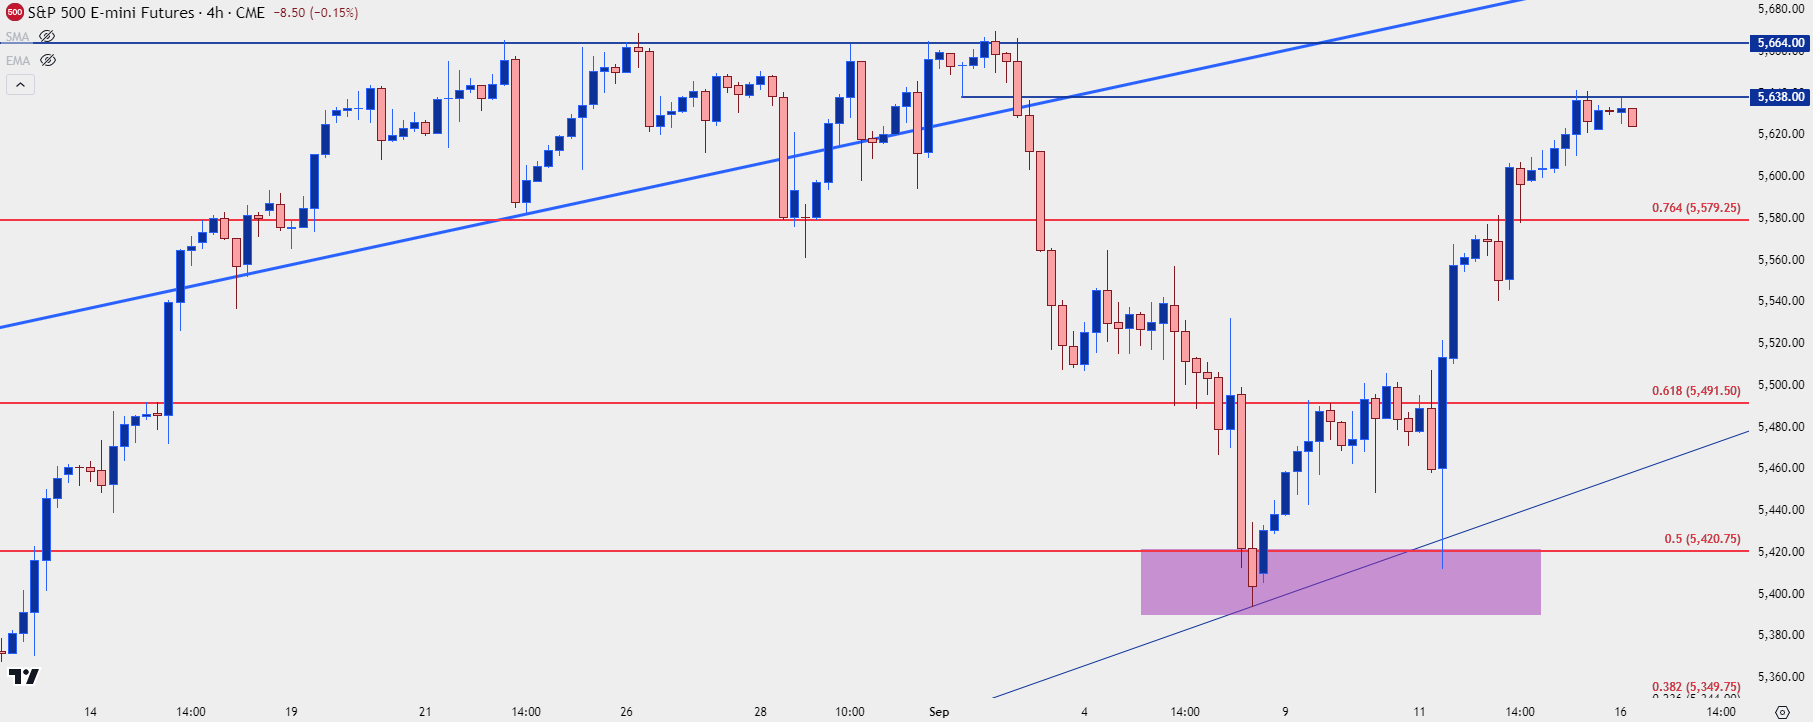 Chart prepared by James Stanley; data derived from Tradingview
S&P 500 Shorter-Term
The below hourly chart you might recognize from last week’s articles and this has a bit more context included. The support zone of note in my opinion runs from 5562.25 up to that 5600 level. Below that, another zone appears from 5533.25 up to 5540, which set the low and led to a sharp move on Thursday morning. Below that is support from prior resistance at 5491.50-5500.
For resistance, there’s the zone from July that held for a couple of weeks and I’m tracking that from 5664 up to 5670. And then above that is a similar style of resistance that held the highs in the index in July through a grinding period, spanning from 5700 up to 5721.
Support
S1: 5600
S2: 5580
S3: 5562.26
S4: 5533.25-5400
Resistance
R1: 5638
R2: 5664-5670
R3: 5700-5721
S&P 500 Futures – Four-Hour Chart
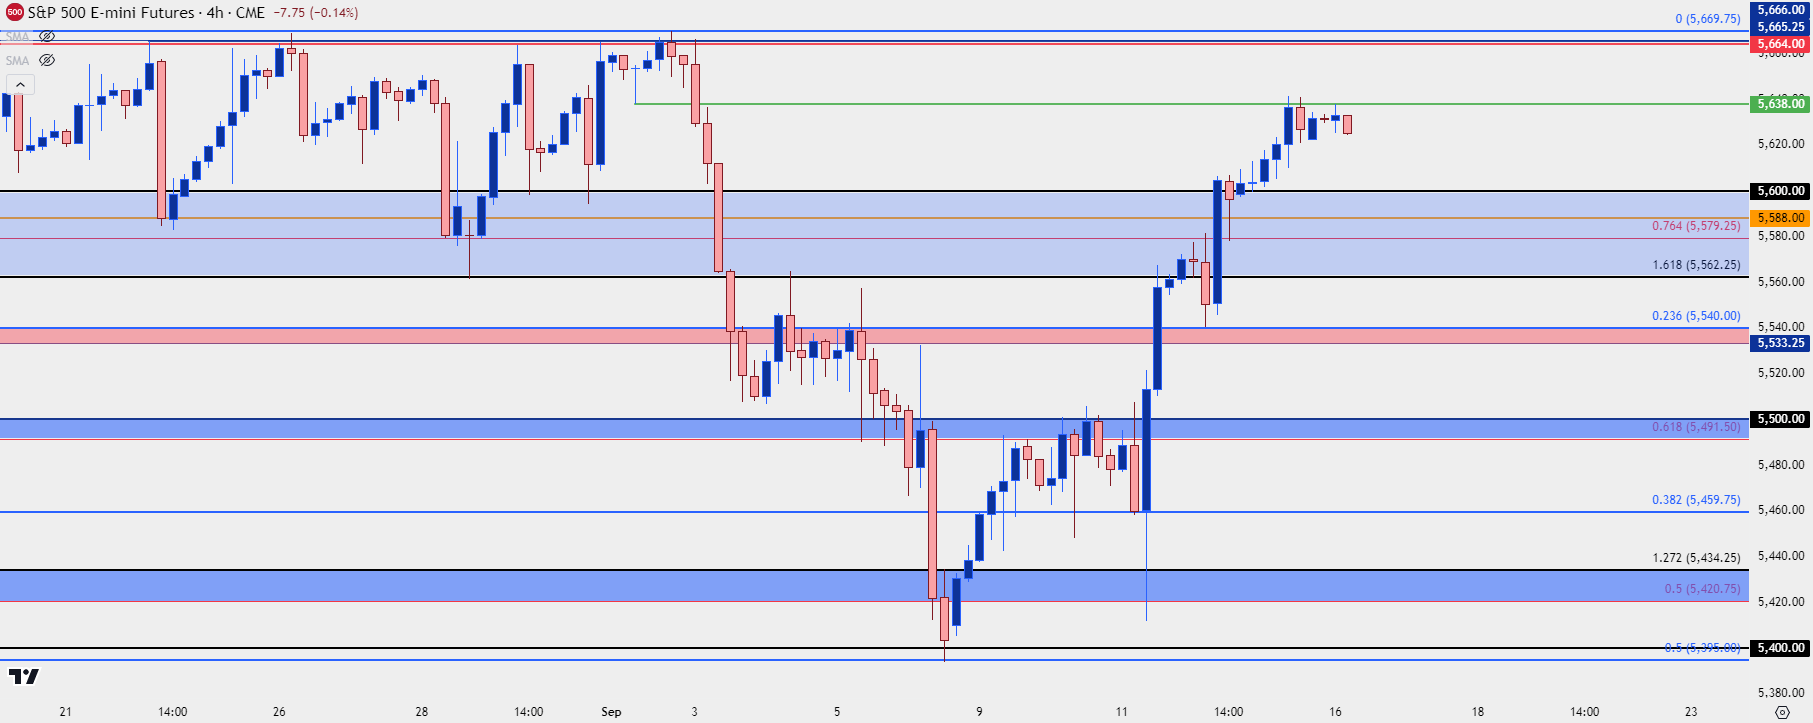 Chart prepared by James Stanley; data derived from Tradingview
--- written by James Stanley, Senior Strategist
Latest market news
September 18, 2025 02:48 PM
June 23, 2025 01:22 PM
June 23, 2025 10:39 AM
June 20, 2025 05:23 PM
June 20, 2025 04:46 PM
June 20, 2025 03:35 PM

June 20, 2025 04:46 PM

June 20, 2025 03:35 PM

June 20, 2025 02:18 PM

June 20, 2025 12:21 PM