

U.S. Dollar Talking Points:
- It’s been a big move in equities over the past couple of weeks and the question now is whether sellers use this bounce to fade the rip or whether buyers continue to push.
- In the webinar, I went in-depth on several macro markets and in this write-up, I touch on a few of the high points.
- To access this webinar in real-time, click here for registration information.
While last week opened with cries of a ‘possible black Monday,’ a week later the premise of such seems non-sensical. But that’s market sentiment for you and I had looked into that, along with the pointlessness of prediction in last week’s episode.
For this week, the focus was squarely on technical backdrops in effort of implementing strategy. At this point, S&P 500 futures are holding in a short-term ascending triangle, often approached with bullish aim of breakout potential. For next resistance above the 5500 level that’s so far proven tough to break, there’s some open exposed gap from after the tariff announcement, covering a 20-handle range from 5564.50-5584.50.

S&P 500 Four-Hour Chart
 Chart prepared by James Stanley; data derived from Tradingview
Risk Factor for Equities
At this point U.S. Treasury yields remain near recent highs and as I shared in the webinar, I consider this a risk factor for stocks. Because if posed with the premise of buying 10-year notes at a yield of 4.5% (or close to it) or chasing stocks higher after a 10% bounce, the bond option begins to look more attractive. And that’s especially the case if you consider that the administration may be looking to push yields lower in order to sell longer-term Treasuries later this year.
That 4.5% mark has clearly brought out some buying activity as it’s been tested twice in the past week in 10-year notes.
U.S. 10-Year Treasury Note Yields
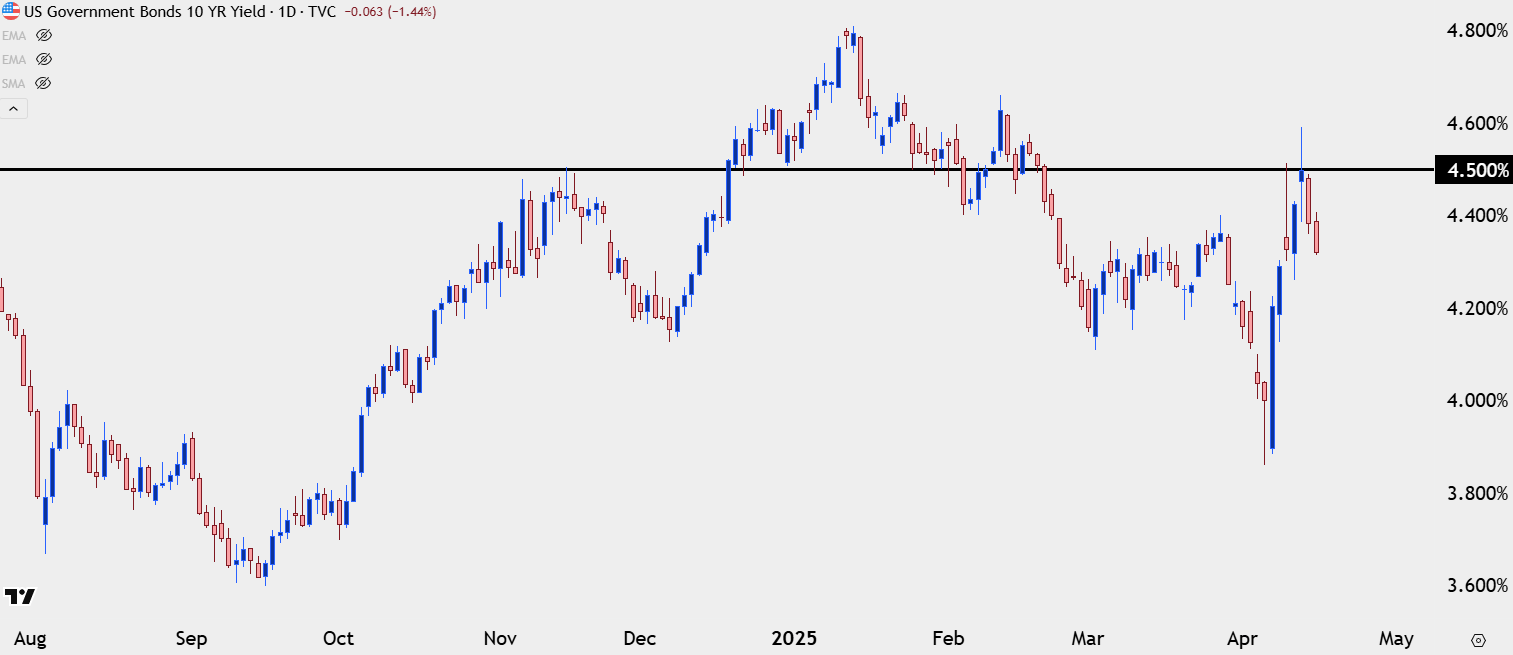 Chart prepared by James Stanley; data derived from Tradingview
Gold
Gold has continued in a near-parabolic like state. Last week’s webinar saw a strong pullback with the $3k level finally getting taken out. There was a hold of support at prior resistance, but the response to that support has been astounding as gold has stretched by as much as 9.8% from last week’s lows.
This is still a tough move to chase, however, and given resistance showing ahead of the $3250 psychological level, there could be scope for a pullback, which highlights the $3150-$3167 area as higher-low support potential.
Gold Four-Hour Price Chart
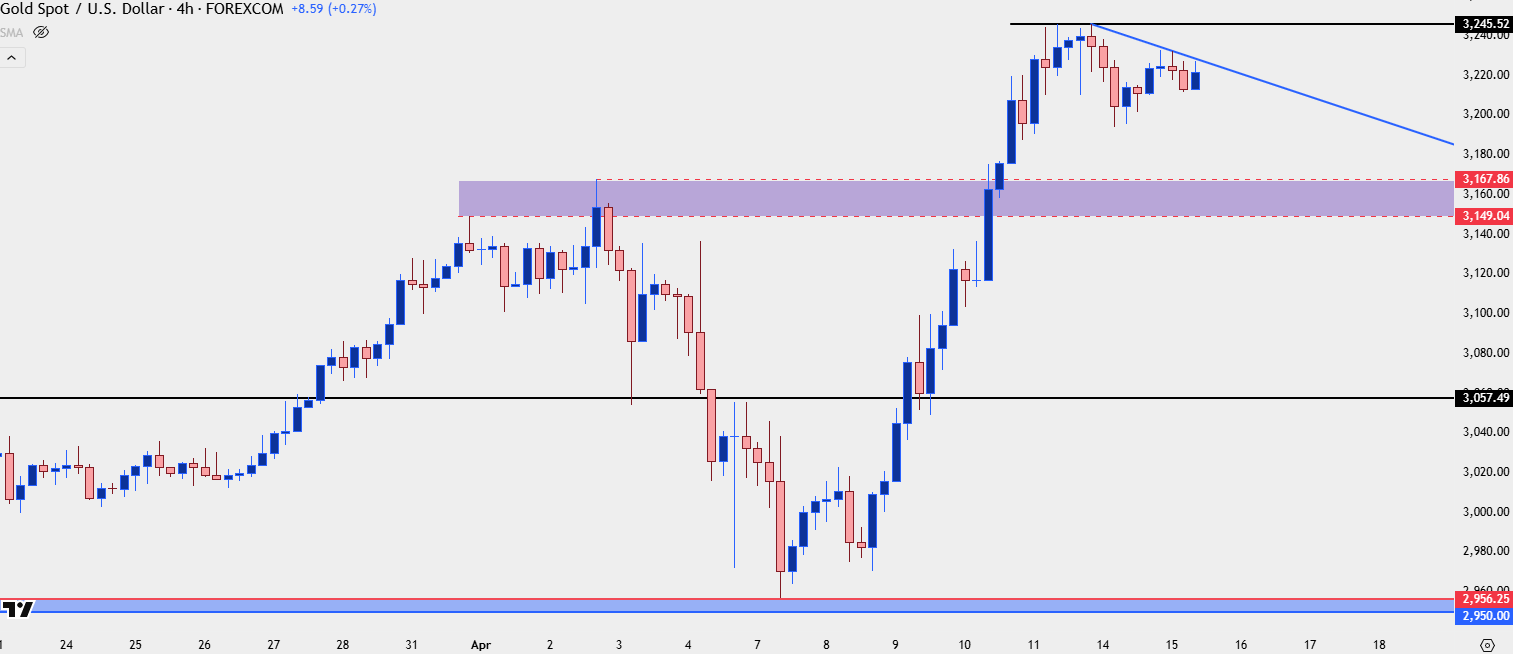 Chart prepared by James Stanley; data derived from Tradingview
USD
Going along with the above macro backdrops, the U.S. Dollar has been beaten down. I’ve written a lot about this over the past couple of trading days, looking into EUR/USD last Friday and then the USD yesterday.
USD went oversold on the weekly chart for only the second time in the past seven years, with the prior instance happening last August before the USD reversal took over. There’s also a Fibonacci level of reference in-play at 98.98, which helps to set the table for a possible bounce. At this point, price is fighting with resistance from prior support at 100.18, and there’s a couple of short-term levels above that at 100.91 and 101.27. But the big zone is between two Fibonacci levels at 101.80-102.00, and if buyers can pose a break above that then bigger picture reversal potential will start to look more attractive.
U.S. Dollar Daily Price Chart
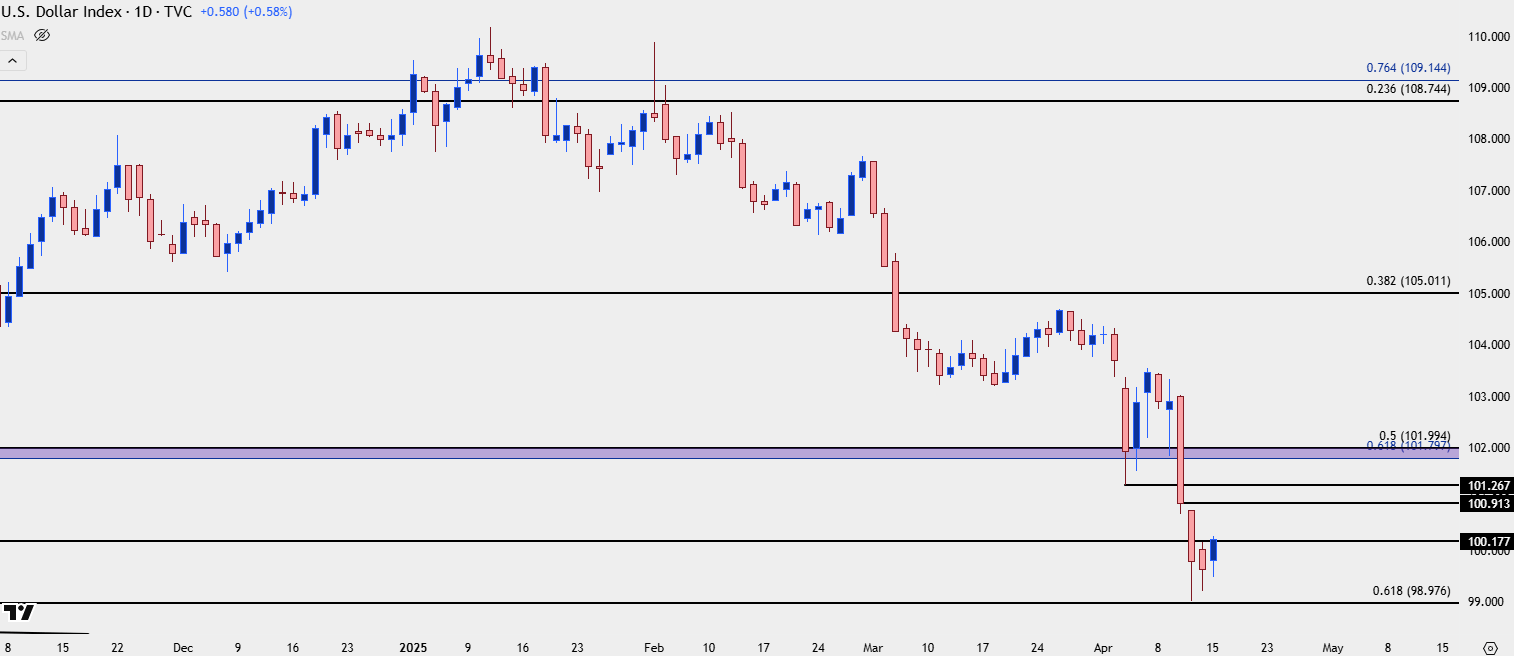 Chart prepared by James Stanley; data derived from Tradingview
EUR/USD
Interestingly, helping to feed that recent USD weakness has been a strong breakout in EUR/USD. And this is for a currency that’s going into a highly anticipated rate cut on Thursday of this week. Given that the Euro is 57.6% of the DXY quote, then logically the moves to show this week will have some bearing on the performance of the USD, but as shared in the webinar this is a bullish backdrop for now with a series of possible support levels in-play.
The 1.1275 Fibonacci level held the highs in 2023 and that’s in-play right now. The 1.1200 level was the brick wall of resistance in Q3 of last year that led into the reversal for Q4. The 1.1100 handle was resistance earlier in April and, so far, hasn’t been turned into support. And there’s even a case for support potential at the 1.1000 handle.
In last week’s webinar, I looked at EUR/USD as one of the more attractive venues for USD-weakness and at the time I was focusing on the 1.0943 Fibonacci level. That price connected down to 1.0900 is what I’m considering as invalidation of the bullish move, so if buyers can hold even 1.1000, there’s a possibility of topside continuation scenarios.

EUR/USD Four-Hour Price Chart
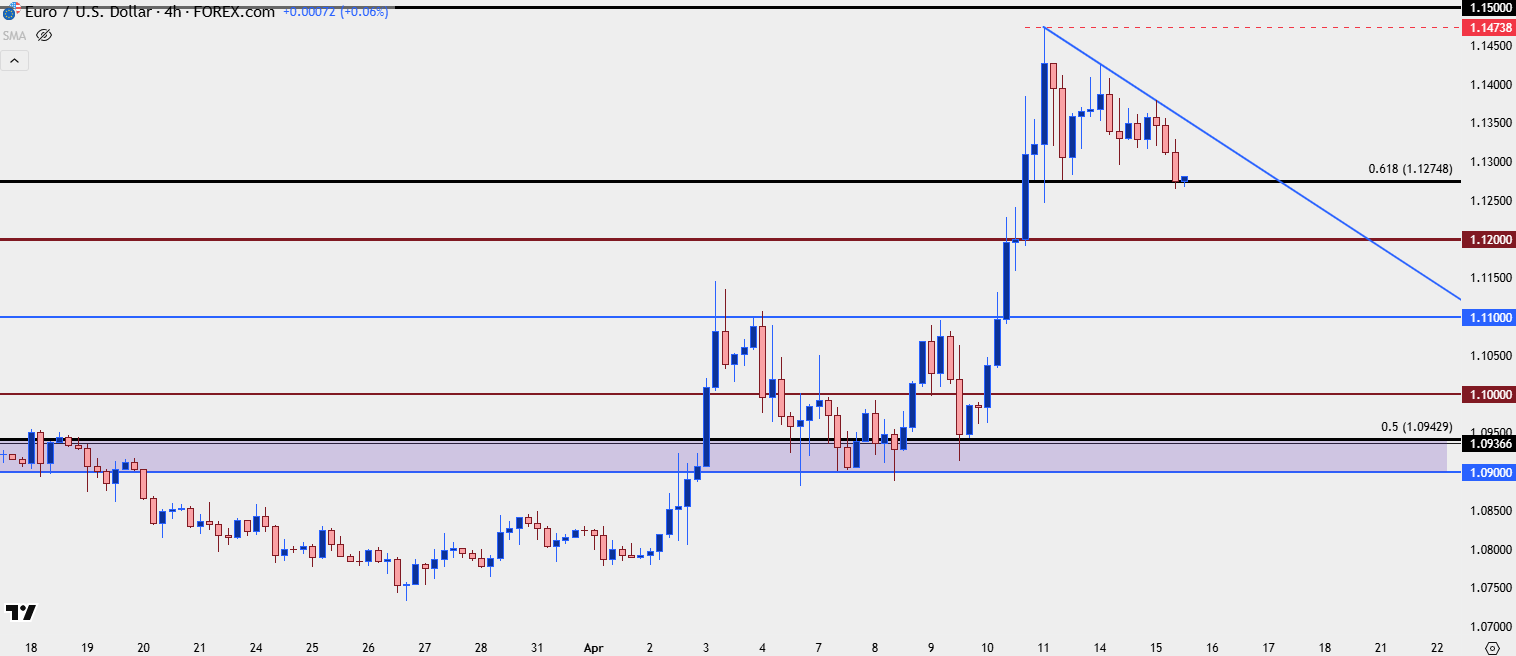 Chart prepared by James Stanley; data derived from Tradingview
--- written by James Stanley, Senior Strategist
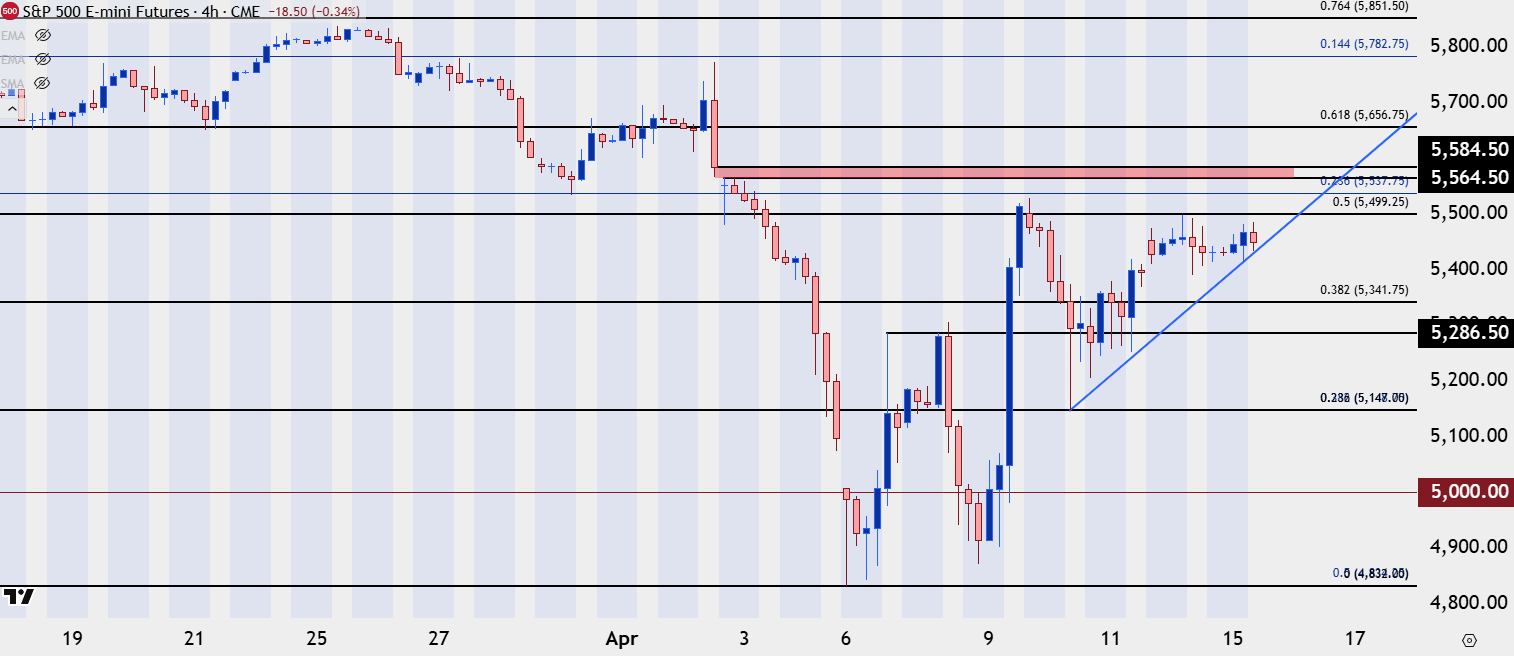 Chart prepared by
 Latest market news
Today 10:00 AM
Today 09:09 AM


Yesterday 09:32 PM