

US Dollar Talking Points:
- The US Dollar continues to hold long-term support at a major spot on the chart.
- USD/JPY continues to drive USD flow as a hold and bounce from 142.50 to start the week have accompanied a short-term bounce in the USD.
- If we do get a turn in the USD, EUR/USD bearish themes remain attractive but if USD bears go for another push to fresh lows, GBP/USD and USD/CAD both remain attractive, looked at in greater depth during the webinar.
- This is a weekly webinar and you’re welcome to attend the next: Click here to register.
USD
It was close but the US Dollar did not finish the May monthly bar as a doji, at least if we’re using the 5% rule of thumb for the candle body size relative to the period’s range. It was just a couple of pips short but does still illustrate a degree of indecision, especially after the aggressive sell-off from March and April has so far held a higher-low since the Easter Monday test at confluent long-term support.
It’s a big week for the USD, with the Friday NFP report the highlight of the weekly calendar. The big question now is whether sellers are aggressive enough to push for a print of a fresh low, or whether buyers can hold a higher-low at the 98.98 Fibonacci level which was in-play since early-April.
US Dollar Weekly Chart
 Chart prepared by James Stanley; data derived from Tradingview
EUR/USD
For USD-strength themes, if we are seeing the USD pushing into a turn, I continue to favor EUR/USD. Going along with that possibility of a higher-low in DXY we have the possibility of a lower-high in EUR/USD, as the pair has held around the 1.1400 handle after the April test at 1.1500. Meanwhile, pairs like GBP/USD and USD/CAD have already driven to fresh highs and lows for the year and those extremes run counter to the US Dollar’s posture from the above weekly chart.
In EUR/USD, the 1.1275 level remains important for shorter-term themes, with 1.1200 and 1.1100 sitting below for shorter-term supports, both levels that played to a degree during May trade.

EUR/USD Weekly Chart
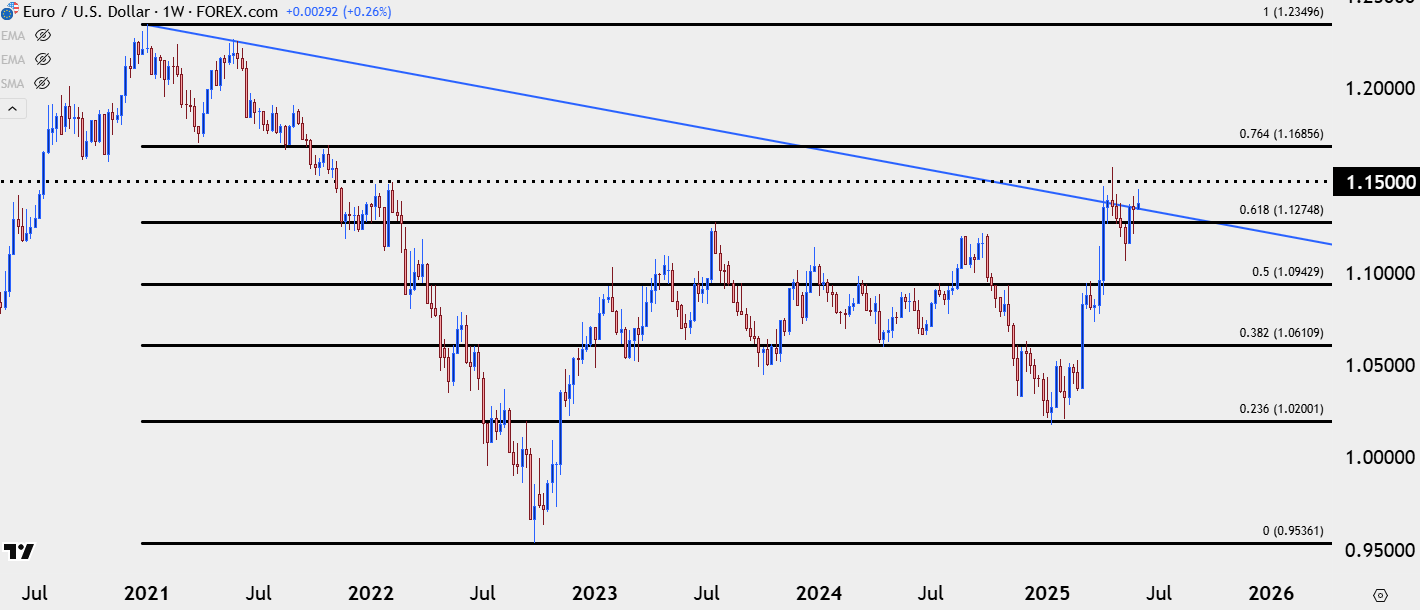 Chart prepared by James Stanley; data derived from Tradingview
GBP/USD
GBP/USD retains bullish structure and last week showed support at a key spot, with bulls starting this week with another test above the 1.3500 level.
The Fibonacci level at 1.3414 helped to set last week’s low after showing as resistance both in Q3 of last year and then in April and May of this year. That’s the spot that bulls need to hold to retain control and if we do see the bearish scenario play in the USD, that bullish structure in GBP/USD remains highly attractive. USD/CAD is also of consideration, but as I showed in the webinar, both a falling wedge and diverging RSI on the daily suggest the possibility of pullback which can make the shorter-term vantage point as a noisier proposition.
GBP/USD Daily Chart
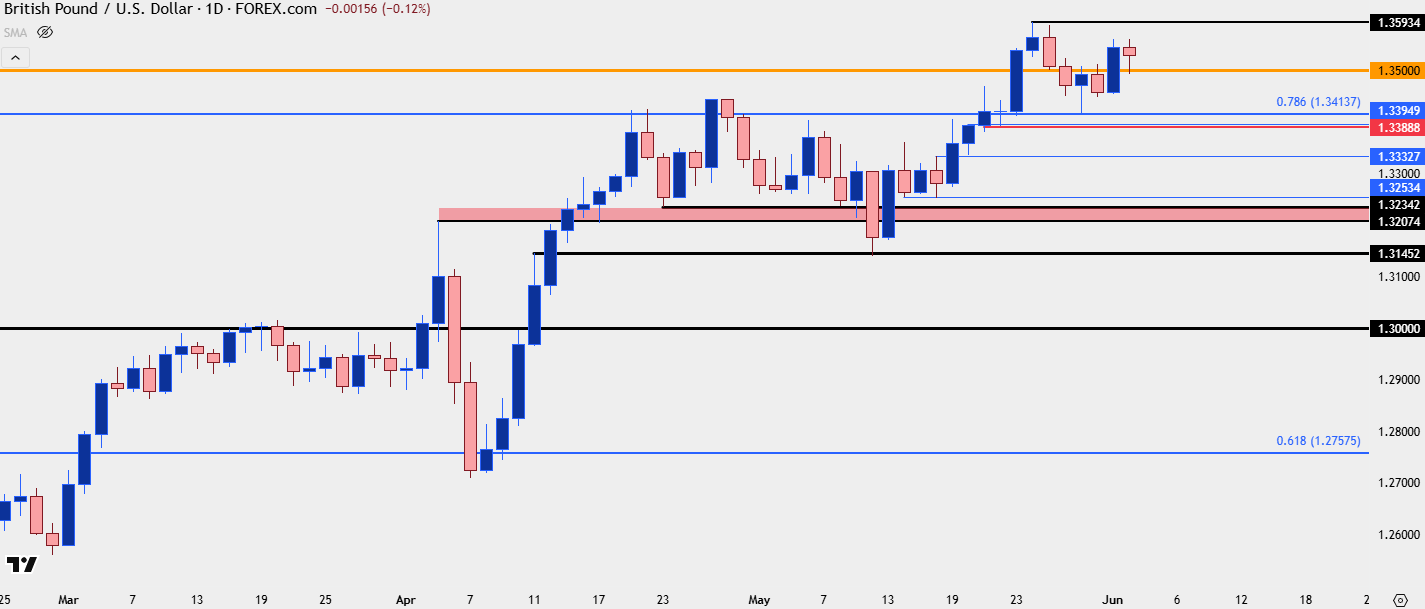 Chart prepared by James Stanley; data derived from Tradingview
USD/JPY
I remain of the mind that USD/JPY is doing much of the driving for the USD, despite the Yen being only a 13.6% clip of the DXY basket. But given how impactful the carry trade was, and the fact that prices remain about 40% higher than early-2021 levels, it’s logical to expect that there’s still some carry traders hanging on here.
The 140.00 level has been critical support for more than a year now, holding three separate tests including last September and then again this April, right around the time that the USD bounce began to show.
If we are to see a deeper drive of USD-weakness, I’d expect USD/JPY to be at the forefront of that move with the pair approaching re-test of 140.00. And conversely if we are to see a bounce in the USD, I think we would need to see a continued pullback from the sell-off in USD/JPY that’s taken on varying stages of intensity so far this year.
For now, the 142.50 level that came in as support this week constitutes a higher-low above last week, and it’s the 145.00 level that remains as the next big spot overhead. Buyers made a run at that price last week and failed which helped to bring USD weakness into the end of last week and the open of this week, so that remains a huge spot on the chart.

USD/JPY Daily Price Chart
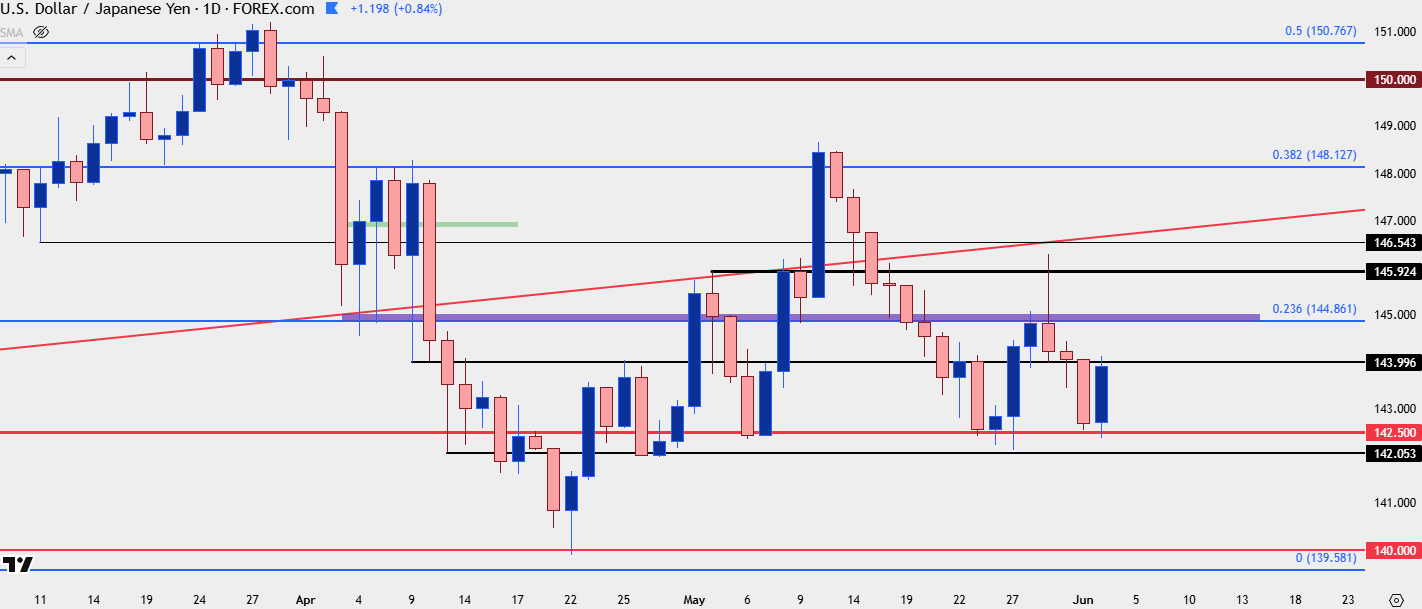 Chart prepared by James Stanley; data derived from Tradingview
Gold
Gold finished last month with a clean doji and that’s a contrast to the blistering bullish trend shown in the metal over the past 15 months. Gold remains highly overbought on the monthly chart and since the $3500 test, bulls haven’t been able to do much above $3350. Collectively this stacks evidence of potential for a pullback, but from shorter-term charts, buyers have continued to respond to supports, such as we saw in mid-May at the test of prior resistance around 3150, or again in late-May to the test of 3250.
Gold Four-Hour Price Chart
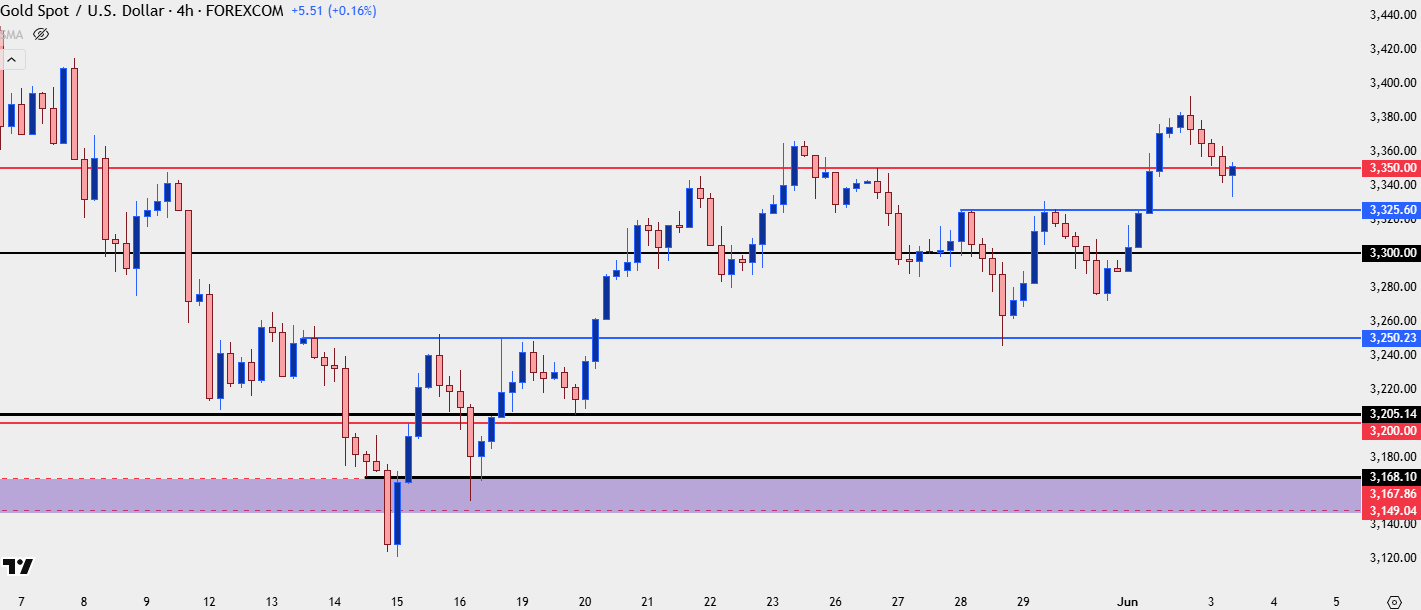 Chart prepared by James Stanley; data derived from Tradingview
--- written by James Stanley, Senior Strategist
Latest market news
September 18, 2025 02:48 PM
June 23, 2025 01:22 PM
June 23, 2025 10:39 AM
June 20, 2025 05:23 PM
June 20, 2025 04:46 PM
June 20, 2025 03:35 PM

February 10, 2025 08:45 PM

February 1, 2025 02:00 AM

January 1, 2025 07:30 AM

December 23, 2024 02:45 PM