

US Dollar Talking Points:
- This webinar was heavily technical-focused and incorporated monthly bars as we near the end of May later this week.
- USD has so far shown indecision following a support bounce in late-April, opening the door for broader turn potential. Correspondingly, EUR/USD is working on a doji for the month of May and that remains as one of the more attractive venues for USD-strength to show. USD/CAD and GBP/USD, on the other hand, remain attractive markets for USD-weakness scenarios.
- This is an archived webinar and you’re welcome to join the next. Click here to register.
Monthly bars aren’t very actionable as we only get 12 per year, but they can be fantastic for reading broader market trends. As a case in point, the USD came into the year with a full head of steam and it seemed like there wasn’t a bear in sight. But – the month of January showed as a doji and then February saw sellers finish the month in the red. And then when March rolled around the USD put in one of its largest sell-offs in years, which continued through the first three weeks of April.
At that point the move had gotten so baked-in that DXY was showing oversold conditions on the weekly chart, and it was around Easter Monday that a massive spot of support came into play which continues to hold the lows into today.
US Dollar Monthly Chart
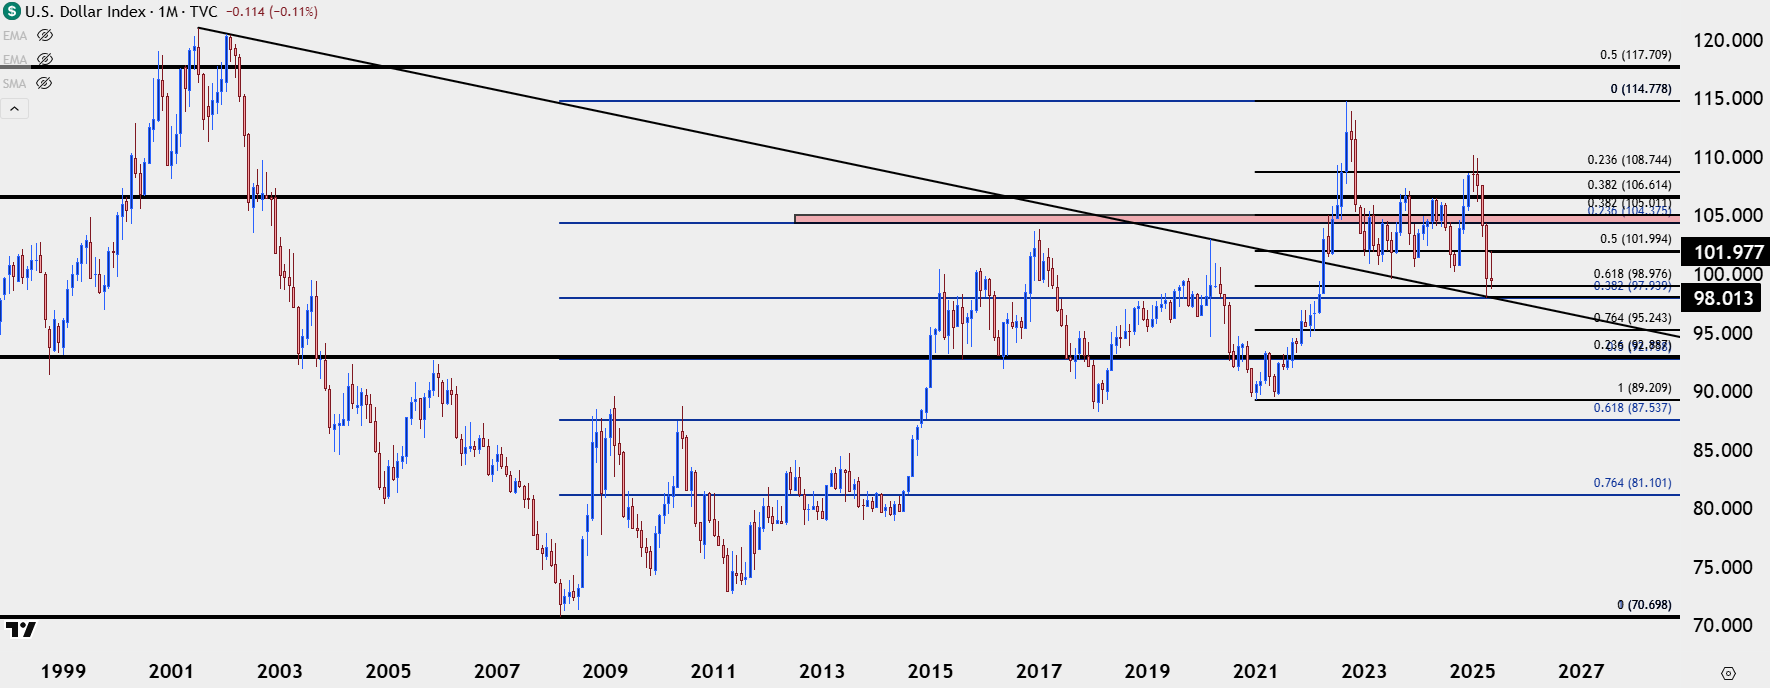 Chart prepared by James Stanley; data derived from Tradingview
USD Weekly
The USD posted four consecutive green weeks following that test of support, and that sequencing came to a head last week as USD sellers extended a push from 102 resistance. Ahead of the May FOMC meeting I had highlighted that level as a major decision point, as it’s a Fibonacci level that could offer longer-term bears the opportunity to jump in after a pullback, as they did.
But the bigger question was whether they’d be able to push all the way down to a fresh low, which so far, they haven’t. What we have seen, however, has been a defense of the Fibonacci level at 98.98 as bulls have showed up. There’s also an interesting overlay with USD/JPY price action, which I’ll look at a little lower, but at this stage, DXY is no longer in oversold territory on the weekly chart.
US Dollar Weekly Chart
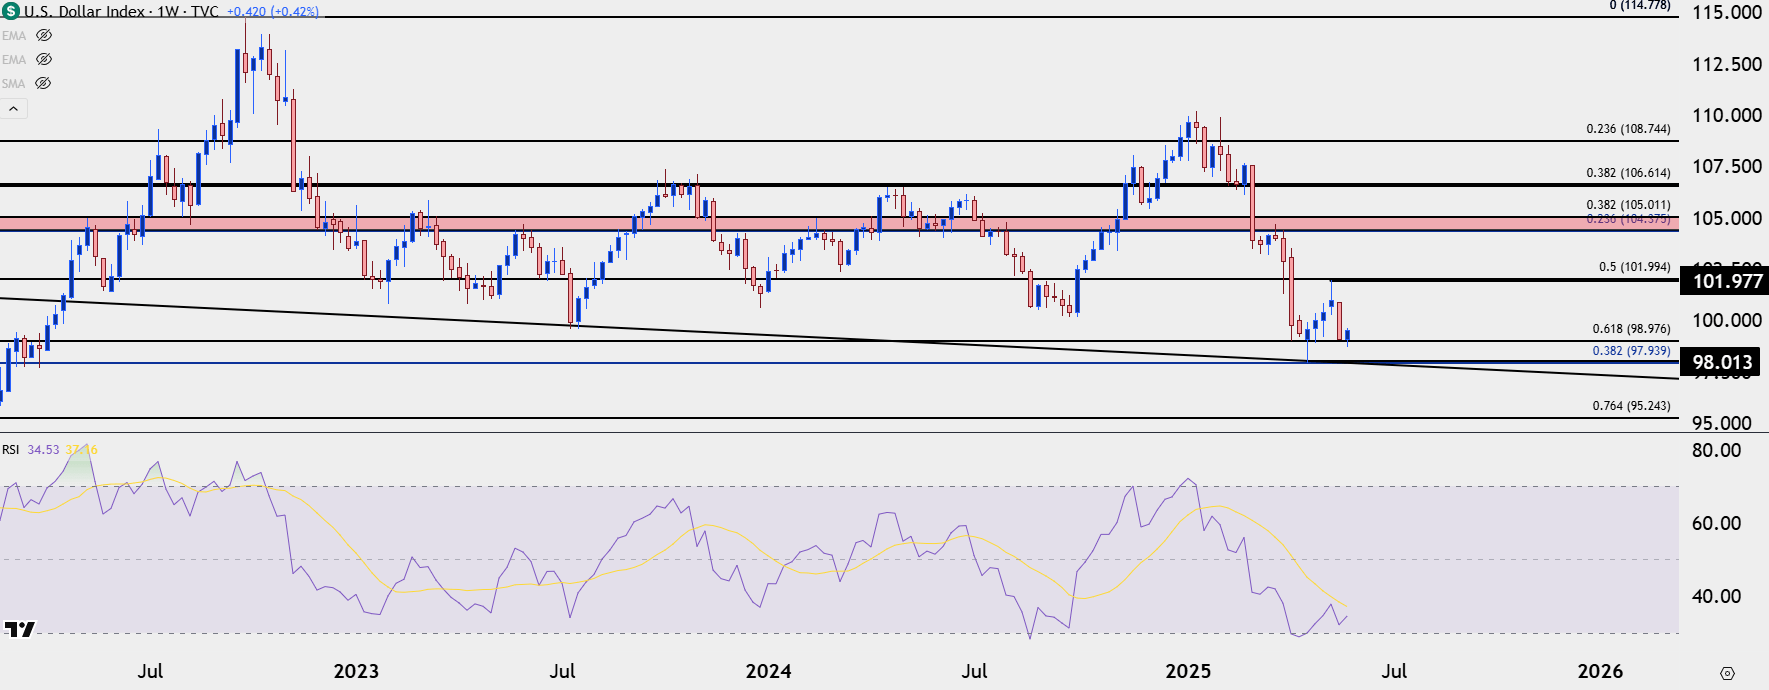
Chart prepared by James Stanley; data derived from Tradingview
EUR/USD
For USD-strength, I remain of the mind that EUR/USD could be one of the more attractive venues.
As USD-weakness showed up last week, we saw USD/CAD crush down to fresh lows and GBP/USD breakout to fresh multi-year highs. EUR/USD, on the other hand, has only been able to rally up to a lower high at the 1.1400 area, and that price along with a trendline projection are holding bulls at bay.
The big level here is 1.1275, the same Fibonacci level that was support-turned-resistance, which is now possible support again.
EUR/USD Weekly Chart
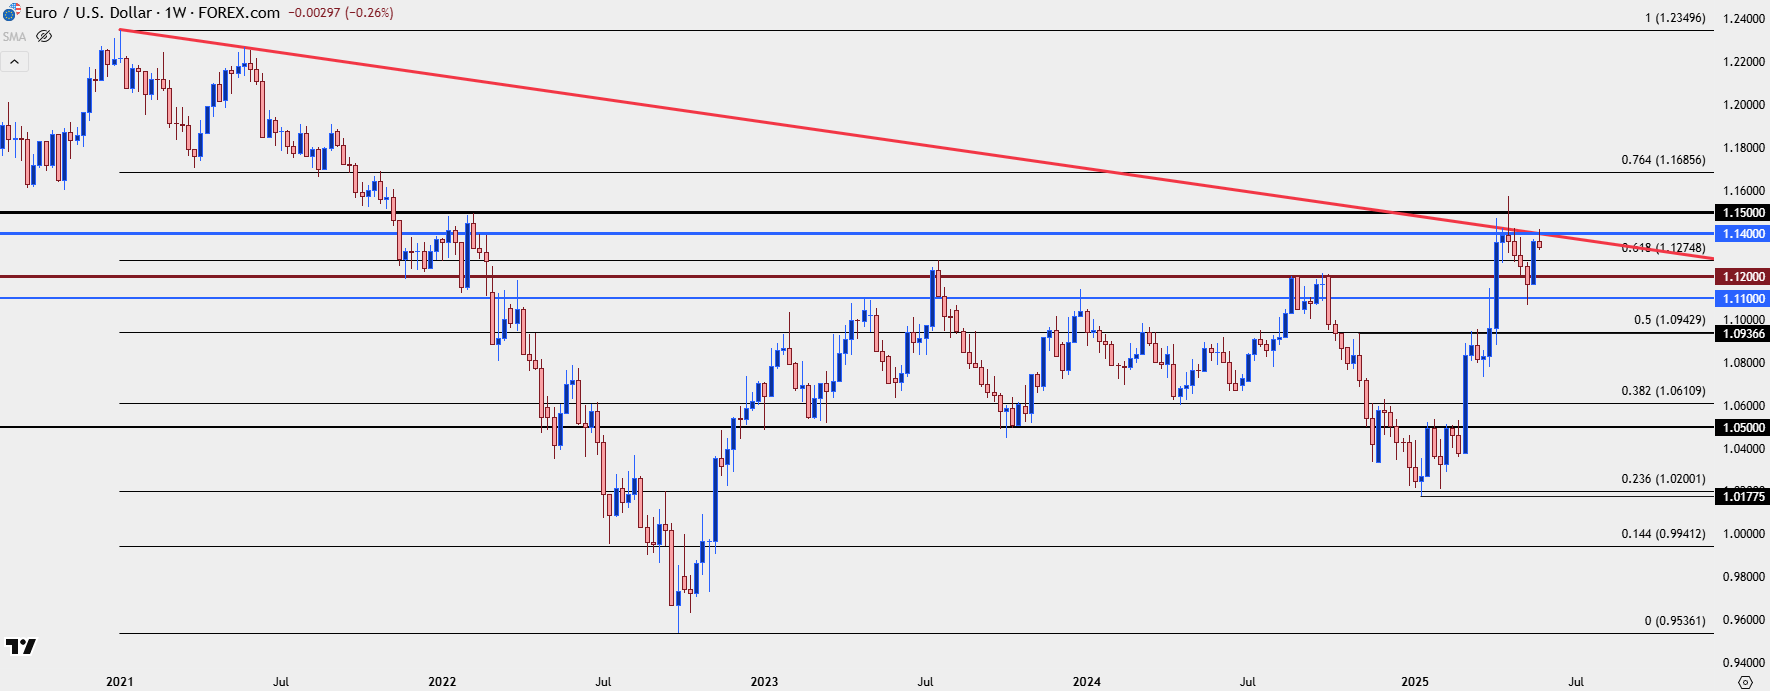 Chart prepared by James Stanley; data derived from Tradingview
EUR/USD Shorter-Term
From the daily we can see the importance of that 1.1275 price, which held the lows last Thursday before bulls drove up for a test of the 1.1400 level. A breach of 1.1275 opens the door for a re-test of 1.1200 and then 1.1100. Below that the 1.1000 level looms large but it’s the 1.0943 level that I’m looking at as a major test as that’s the 50% mark from the same Fibonacci study that produced the 1.1275 level along with the 1.0200 level, which currently marks the 2025 low in the pair.

EUR/USD Daily Chart
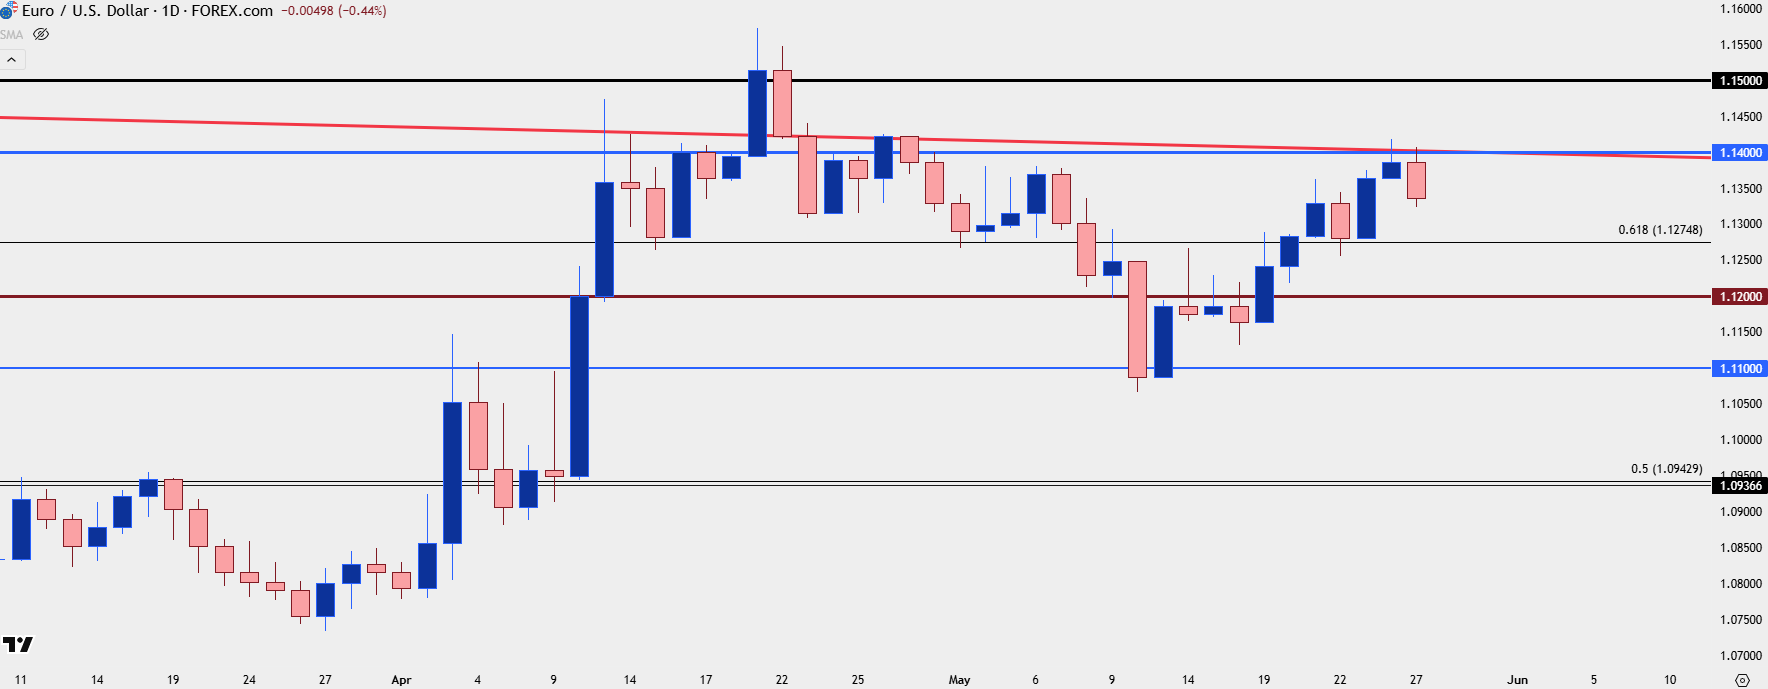 Chart prepared by James Stanley; data derived from Tradingview
USD/CAD
As the USD slid last week, USD/CAD broke down to a fresh 2025 low. Before that, even as the USD strength theme was playing out, USD/CAD showed a beautiful hold of resistance right around the 1.4000 level, which led to a series of lower-highs until sellers were able to capitalize last week.
This remains as one of the more attractive venues for USD-weakness, in my opinion, and much of that can be dialed back to the longer-term range in the pair. But – for now – USD bulls are showing up and this threatens a pullback. That highlights lower-high resistance potential at 1.3781, 1.3813 and then overhead, at 1.3890-1.3905.
USD/CAD Four-Hour Chart
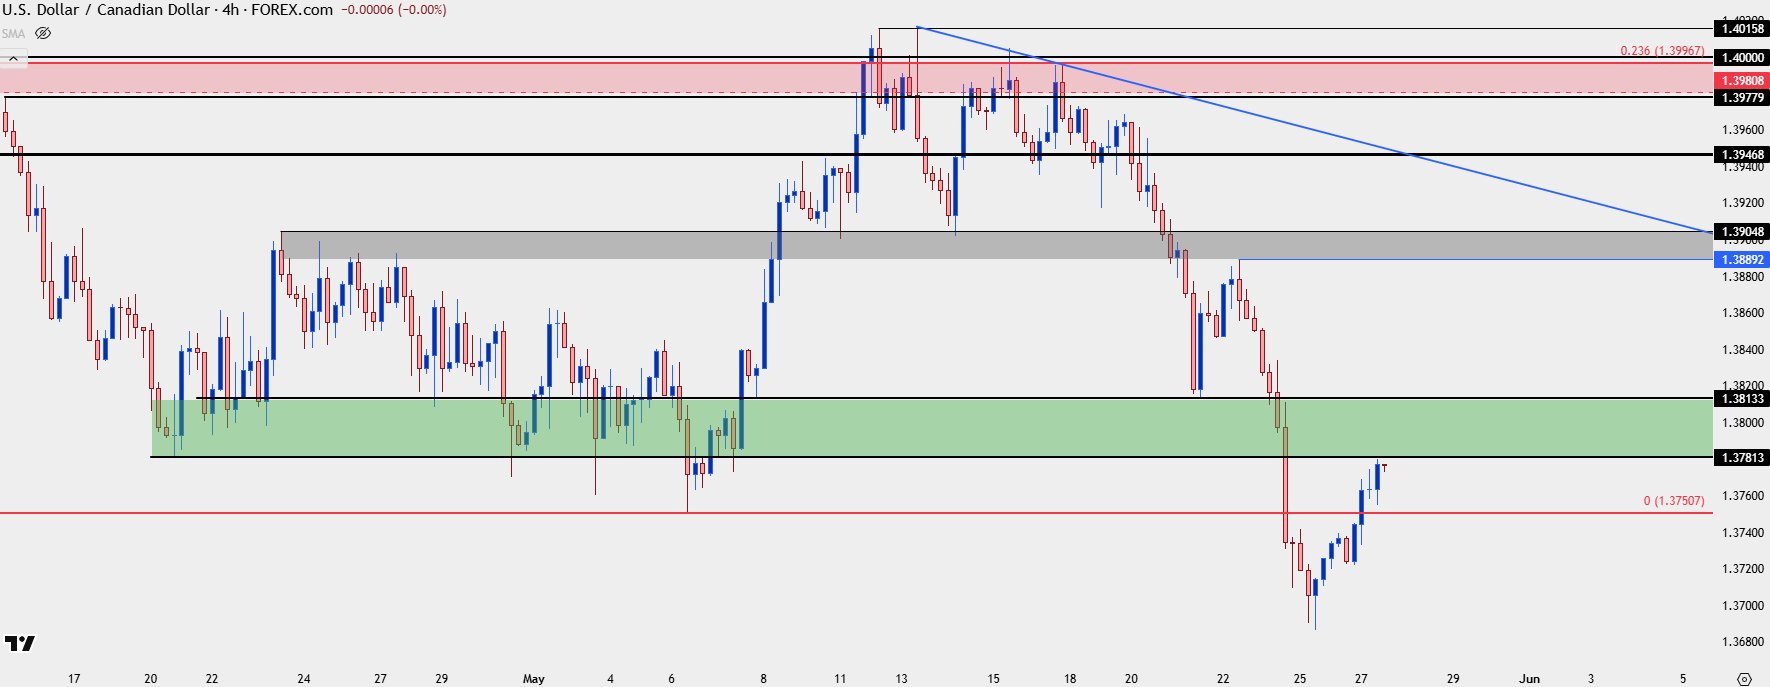 Chart prepared by James Stanley; data derived from Tradingview
GBP/USD
I’ve also been tracking Cable for USD-weakness scenarios and last week showed a strong breakout at a big level, with the 1.3414 Fibonacci level finally yielding to breakout into 1.3500.
Similar to the above in USD/CAD, chasing is tough at these extremes, but that opens the door for pullback potential; and in this case, that highlights support potential at that same level of prior resistance, around 1.3414 in GBP/USD.

GBP/USD Weekly Chart
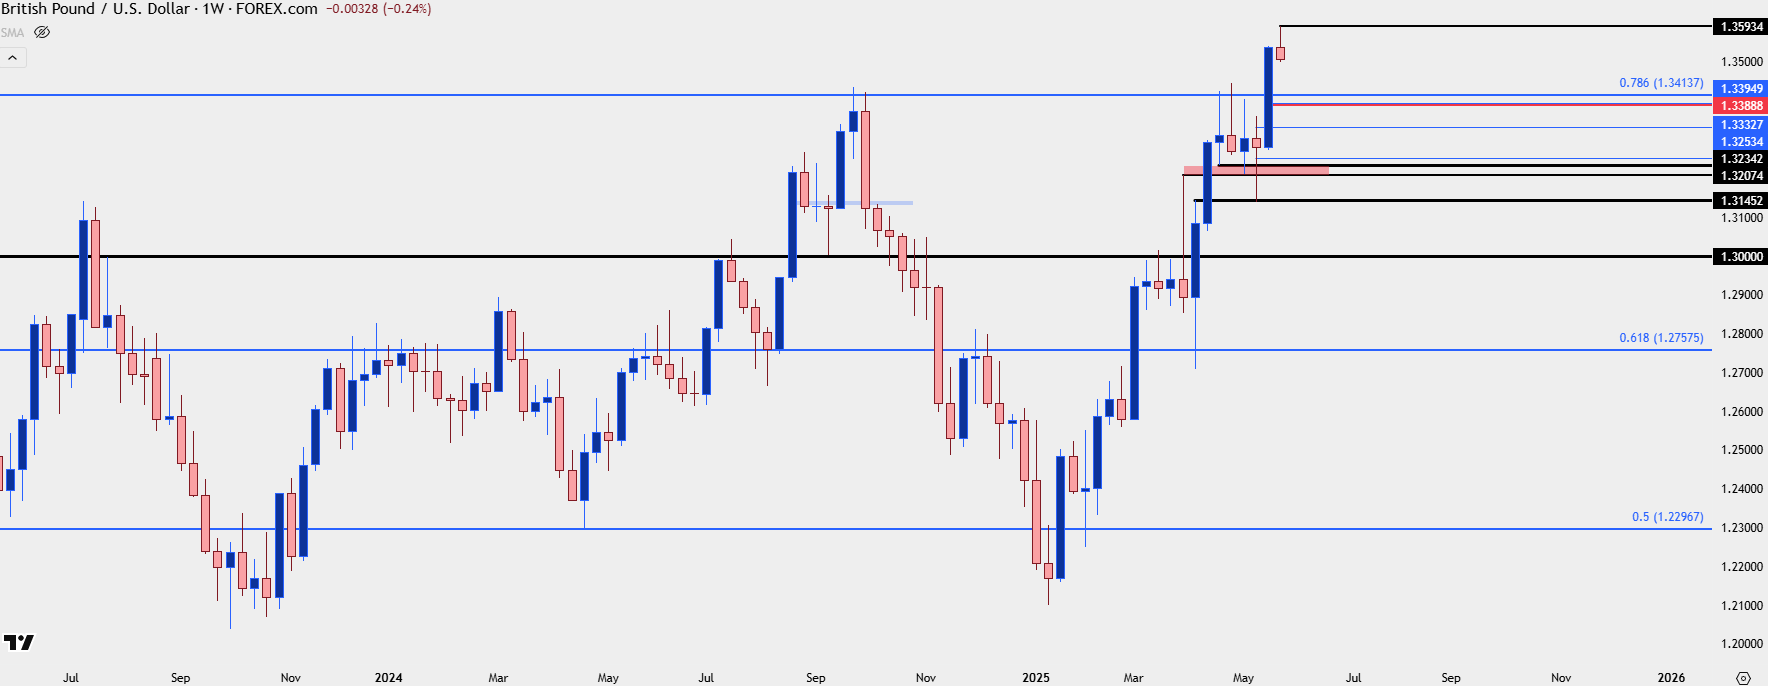 Chart prepared by James Stanley; data derived from Tradingview
USD/JPY
I remain of the mind that the larger carry trade in USD/JPY continues to sway dynamics in the US Dollar, and that can remain pertinent in pairs like EUR/USD and GBP/USD. Even though the Japanese Yen is just 13.6% of the DXY basket, the pair remains a little under 40% above the 2021 lows, when the carry trade began to build. Like I looked at last week, the undoing of that could carry massive consequence and not just for FX markets, as the carry trade is essentially a form of global leverage and that leverage coming out of the system could have catastrophic consequences for stocks, like we saw last summer.
At this point, however, fear is taking a step back as Japanese Yields have pulled back aggressively, helping USD/JPY to recover. This will remain a hot button, in my opinion, but speaking to one of the main themes from this webinar, the premise of a USD turn if the monthly bar finishes as indecisive, continued USD/JPY strength would be a big factor for that theme coming to fruition.

USD/JPY Daily Chart
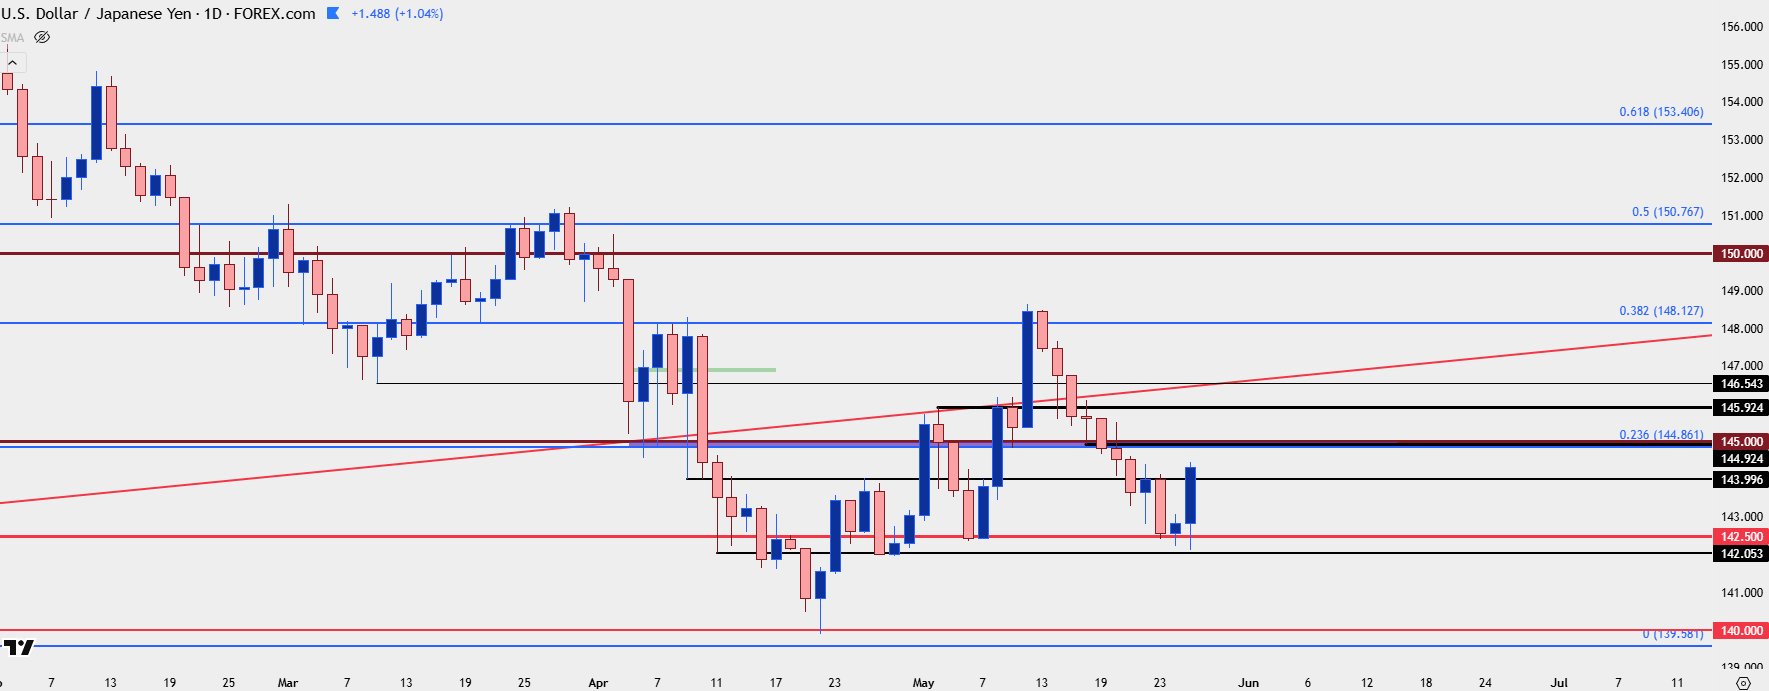 Chart prepared by James Stanley; data derived from Tradingview
--- written by James Stanley, Senior Strategist
Latest market news
September 18, 2025 02:48 PM
June 23, 2025 01:22 PM
June 23, 2025 10:39 AM
June 20, 2025 05:23 PM
June 20, 2025 04:46 PM
June 20, 2025 03:35 PM

June 20, 2025 04:46 PM

June 20, 2025 03:35 PM

June 20, 2025 02:18 PM

June 20, 2025 12:21 PM