

US Dollar Index Technical Outlook: USD Short-term Trade Levels
- US Dollar recovery stalls into trend resistance- Threat for larger recovery while above 99
- USD weekly / monthly opening-range intact post-FOMC, breakout imminent
- Resistance 99.96-100.42, 101.92 (key), 101.77/92 - Support 99.15, 97.71-98.39 (key), 96
The US Dollar Index continues to coil into the weekly opening-range post-Fed with DXY poised to close the session up more than 0.45%. The threat of stagflation continues to limit the central bank’s willingness to cut rates, and for the greenback, the focus now shifts to a breakout of the May range. Battles lines drawn for the bulls on the DXY short-term technical charts.
Review my latest Weekly Strategy Webinar for an in-depth breakdown of this US Dollar technical setup and more. Join live on Monday’s at 8:30am EST.US Dollar Index Price Chart – USD Daily
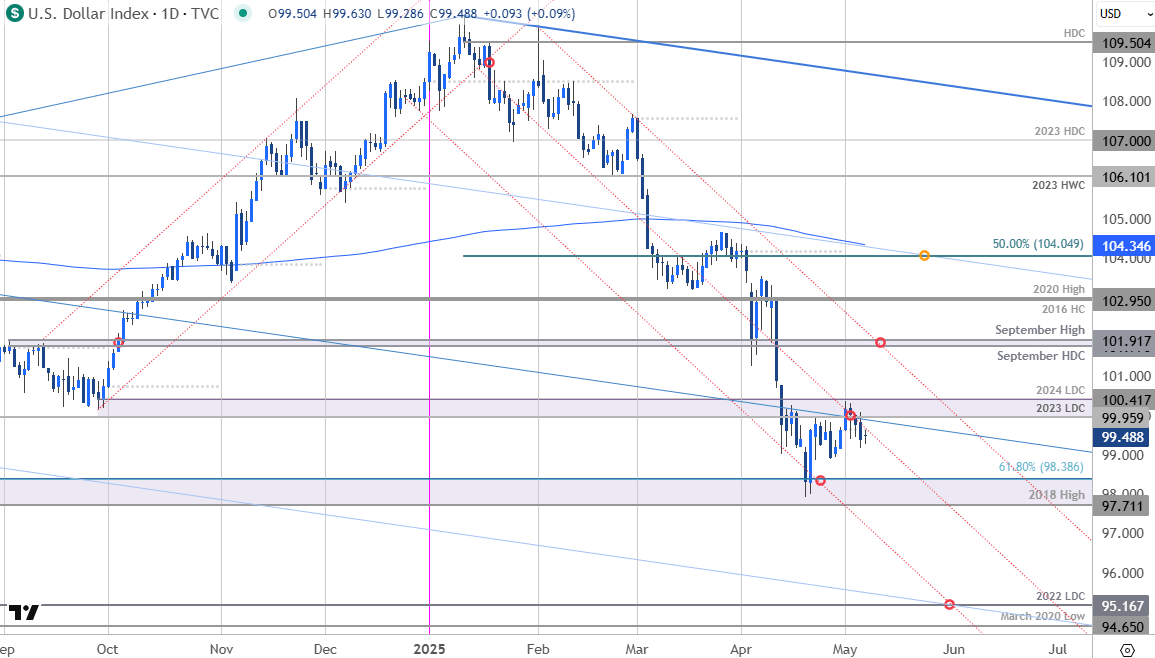
Chart Prepared by Michael Boutros, Sr. Technical Strategist; DXY on TradingView
Technical Outlook: In my last US Dollar Short-term Outlook we noted that a rebound off key support was approaching resistance and that, “from a trading standpoint, losses should be limited to this week’s low IF price is heading higher on this stretch with a breach above 100.42 needed to fuel the next leg of the recovery.” DXY registered an intraday high at 100.38 later that day before faltering. The weekly & monthly opening-ranges are now defined by the 99.96-100.42 resistance zone- a region define by the 2023 & 2024 low day closes (LDC). The focus remains on possible price inflection off this zone with the bulls vulnerable while below.
US Dollar Index Price Chart – USD 240min
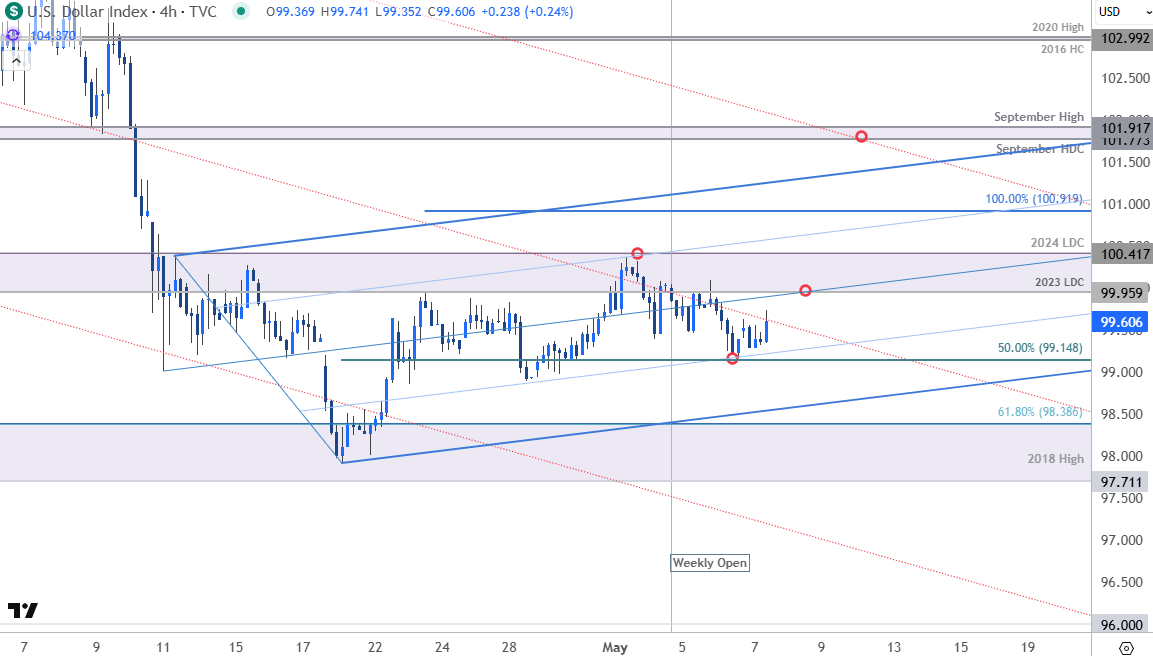
Chart Prepared by Michael Boutros, Sr. Technical Strategist; DXY on TradingView
Notes: A closer look at USD price action shows the index trading within the confines of a proposed ascending pitchfork extending off the April lows with the 25% parallel offering support on this advance off the lows. Initial lateral support rests with the 50% retracement at 99.15 and is backed by the lower parallel. Ultimately, a break / weekly close below key support at 97.71-98.37 is needed to mark resumption of the broader downtrend towards the 96-handle.
A topside breach above this key pivot zone exposes the 100% extension of the April advance at 100.92 and the upper parallel. Broader bearish invalidation remains with the September high / high-day close (HDC) at 101.77/92- look for a larger reaction there IF reached with a breach / close above needed to suggest a more significant low was registered last month / a larger reversal is underway.

Bottom line: A rebound off confluent downtrend support is now testing initial trend resistance with the weekly & monthly opening-ranges taking shape just below- look for the breakout. From a trading standpoint, losses would need to be limited to the lower parallel of this near-term formation IF price is heading higher here with a breach / close above 100.42 needed to fuel the next leg of the recovery.
Keep in mind we have key inflation data on tap next week with the April Consumer Price Index (CPI) slated for Tuesday. Stay nimble into the releases and watch the weekly closes here for guidance. Review my latest US Dollar Weekly Forecast for a closer look at the longer-term DXY technical trade levels.
Key US Economic Data Releases
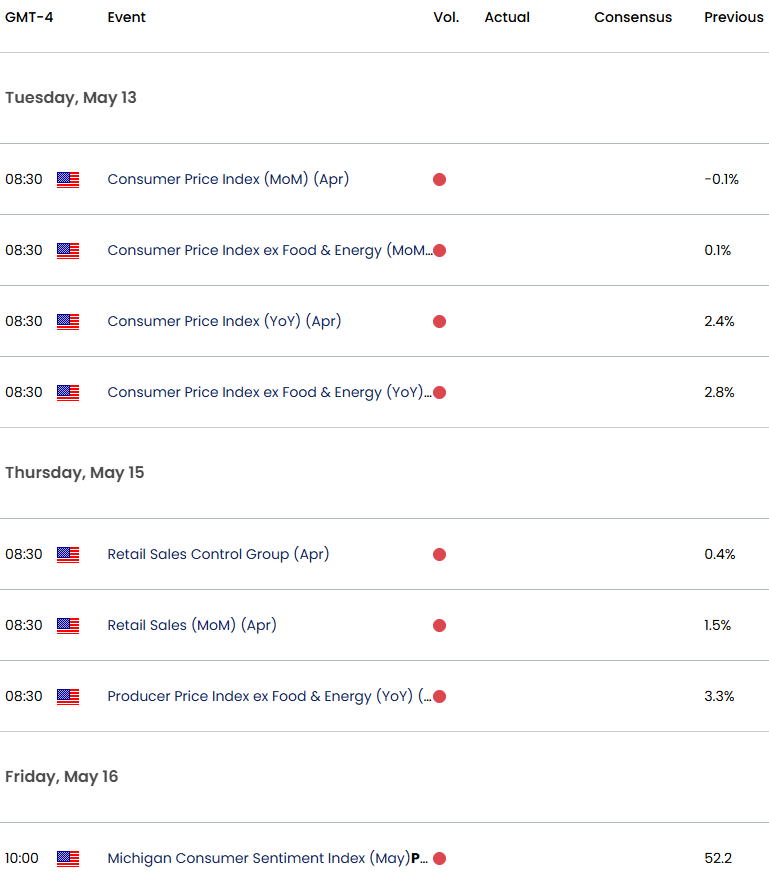
Economic Calendar - latest economic developments and upcoming event risk.
Active Short-term Technical Charts
- Euro Short-term Outlook: EUR/USD Poised for Breakout Ahead of Fed
- Swiss Franc Short-term Outlook: USD/CHF Coils Ahead of Fed
- Gold Short-term Outlook: XAU/USD Breaks Below Support, Bulls Poised
- Japanese Yen Short-term Outlook: USD/JPY Coils Ahead of BoJ, NFP
- British Pound Short-term Outlook: GBP/USD Bulls Eye 2024 High
- Australian Dollar Short-term Outlook: AUD/USD Halted at Resistance
- Canadian Dollar Short-term Outlook: USD/CAD Breakout Imminent
Written by Michael Boutros, Sr Technical Strategist with FOREX.com
Follow Michael on X @MBForex
Latest market news
September 18, 2025 02:48 PM
June 23, 2025 01:22 PM
June 23, 2025 10:39 AM
June 20, 2025 05:23 PM
June 20, 2025 04:46 PM
June 20, 2025 03:35 PM

June 9, 2025 03:52 PM

June 6, 2025 05:41 PM

May 21, 2025 07:02 PM

May 20, 2025 06:58 PM