

US Dollar Index Technical Forecast: USD Weekly Trade Levels (DXY)
- US Dollar plunges to fresh multi-year lows as bears attempt fifth consecutive weekly decline
- USD now testing major technical support confluence- U.S. CPI / NFP on tap
- DXY Resistance 99.57/67, 101.50s, 102.74/99 (key)- Support 97.69-98.39 (key), 94.65/98, 93.93
The US Dollar collapse has been spectacular with weekly momentum now registering the lowest oversold reading since January 2018. The bears have driven DXY into major technical pivot-zone and while a break of a multi-decade slope does threaten further losses, the immediate decline may be vulnerable here. Battle lines drawn on the DXY weekly technical charts heading into the close of April.
Review my latest Weekly Strategy Webinar for an in-depth breakdown of this USD setup and more. Join live on Monday’s at 8:30am EST.US Dollar Price Chart – USD Weekly (DXY)

Chart Prepared by Michael Boutros, Sr. Technical Strategist; DXY on TradingView
Technical Outlook: In my last US Dollar Technical Forecast we noted that, “A reversal off uptrend resistance is now testing the trend support- looking for a reaction into 106.04/35. From a trading standpoint, a good zone to reduce portions of short-exposure / lower protective stops- rallies should be limited to the yearly open IF price is heading lower on this stretch with a close below 106.04 needed to fuel the next leg of the decline.”
USD broke through support two-weeks later with the index plunging more than 11.1% off the yearly high. Note that price has broken below a trendline we have been tracking for over a decade (the 2011 original slope) and the implications of the technical damage here are significant- risk for further loses while below this slope.
The bears are attempting to mark a fifth-consecutive weekly decline for the first time since August with price now testing a major technical confluence at 97.69-98.39- a region defined by the 2018 swing high and the 61.8% Fibonacci retracement of the 2018 advance. Note that the median-line of a newly identified descending pitchfork also converges on this zone over the next few weeks and a break / close below would be needed to mark downtrend resumption. Subsequent support objectives seen at the March 2020 low / 100% extension of the 2022 decline at 94.65/97 and the 78.6% retracement at 93.93.
Initial weekly resistance is eyed at the 2023 low / 2019 high at 99.57/66 and is backed by the 2011 slope (currently ~101.50s). Key resistance / bearish invalidation now lowered to 102.74/99- a region defined by the 2024 March low-week close (LWC), the 2020 swing high, and the 2016 high-close (HC). Ultimately, a breach / weekly close above this threshold would be needed to suggest a more significant low is in place / a larger reversal is underway.

Bottom line: A five-week decline is now testing confluent support and while the broader outlook remains tilted to the downside, the immediate decline may be vulnerable while above the median-line. Looking for possible exhaustion / price inflection into this zone in the days ahead. From a trading standpoint, rallies should be limited to the 2011 slope (101.50s) IF price is heading lower on this stretch with a close below 97.69 needed to fuel the next major leg of the decline.
Keep in mind we get the release of key U.S. inflation data next week with Core Personal Consumption Expenditure (PCE) on tap Thursday ahead of Non-Farm Payrolls. Stay nimble into the releases and watch the weekly / monthly closes here for guidance. I’ll publish an updated US Dollar Short-term Outlook once we get further clarity on the near-term DXY technical trade levels.
Key Economic Data Releases
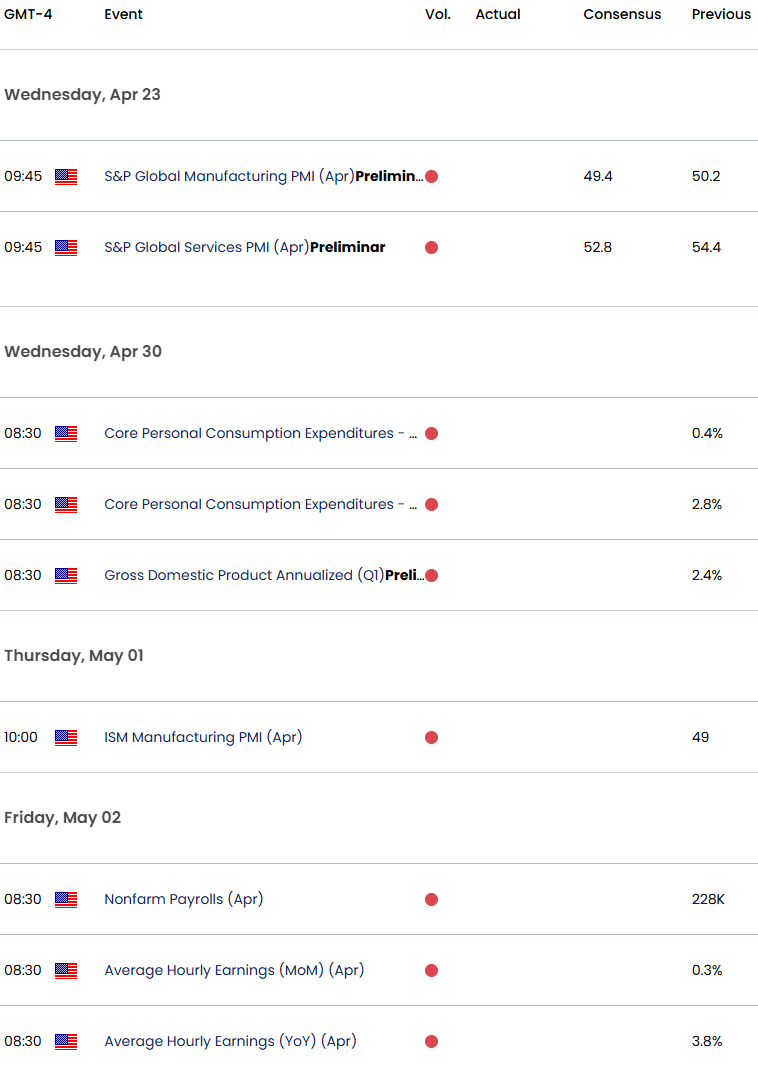
Economic Calendar - latest economic developments and upcoming event risk.
Active Weekly Technical Charts
- Euro (EUR/USD)
- Australian Dollar (AUD/USD)
- British Pound (GBP/USD)
- Canadian Dollar (USD/CAD)
- Japanese Yen (USD/JPY)
- Gold (XAU/USD)
- S&P 500, Nasdaq, Dow
- Crude Oil (WTI)
--- Written by Michael Boutros, Sr Technical Strategist
Follow Michael on X @MBForex
Latest market news
September 18, 2025 02:48 PM
June 23, 2025 01:22 PM
June 23, 2025 10:39 AM
June 20, 2025 05:23 PM
June 20, 2025 04:46 PM
June 20, 2025 03:35 PM

June 17, 2025 08:37 AM

June 16, 2025 08:38 AM

June 2, 2025 08:50 AM

May 28, 2025 02:31 PM