

US Dollar Index Technical Forecast: USD Weekly Trade Levels (DXY)
- US Dollar April rebound falters at former support- DXY plunges back towards key pivot zone at yearly lows
- USD yearly downtrend vulnerable / June opening-range in focus- U.S. NFP on tap
- DXY Resistance 99.58/66, 100.80s, 102.60/99 (key)- Support 97.69-98.39 (key), 94.65/98, 91.92
The US Dollar is under pressure but holding above critical support, with DXY stabilizing just off the yearly lows. It’s decision time for the bears as the monthly opening-range takes shape just above pivotal support with NFPs on tap. Battle lines drawn on the DXY weekly technical charts heading.
Review my latest Weekly Strategy Webinar for an in-depth breakdown of this USD setup and more. Join live on Monday’s at 8:30am EST.US Dollar Price Chart – USD Weekly (DXY)
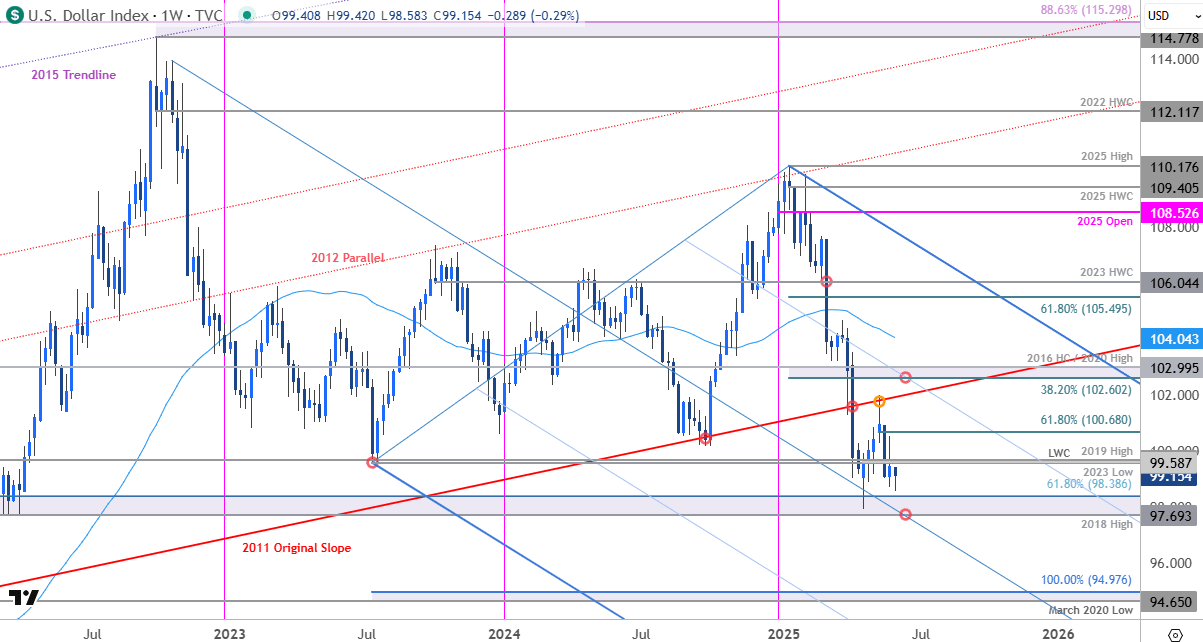
Technical Outlook: In last month’s US Dollar Technical Forecast we noted the DXY recovery was approaching initial resistance hurdles and that, “From at trading standpoint, losses should be limited to 99.58 IF price is heading higher on this stretch with a close above 100.81 needed to fuel the next leg of the advance.” The index ripped higher the following week with a rally of more than 4.1% registering an intraweek high at 101.98 before reversing sharply off the 2011 trendline.
A decline of more than 3.3% takes price back below a key pivot zone we’ve been tracking for months now at 99.58/66- a region defined by the 2023 swing low, the 2019 swing high, and the 2025 low-week close (LWC). Look for initial resistance there now backed by the 61.8% retracement of the May decline at 100.68 and the 2011 slope (currently near ~101.80s). Key resistance / bearish invalidation remains with the 38.2% retracement / 2016 high-close / 2020 high 102.60/99- a breach / close above this threshold would be needed to suggest a more significant low was registered in April / a larger trend reversal is underway.
Critical support remains unchanged at 97.69-98.39- a region defined by the 2018 swig high, the yearly swing low, and the 61.8% retracement of the broader 2018 advance. Note that the median-line converges on this threshold over the next few weeks and a break / close below would threaten another bout of accelerated losses. Subsequent support seen at the March 2020 low / 100% extension of the 2022 decline at 94.65/98 and the 2016 swing low at 91.92.

Bottom line: The U.S. Dollar is trading just above pivotal support at the yearly lows into the start of the month. From a trading standpoint, the focus is on a breakout of the 97.69-100.68 range for guidance with the broader decline vulnerable while above median-line support. Ultimately, rallies would need to be capped by the 2011 original slope IF price is heading lower on this stretch with a break / weekly close below 97.69 needed to mark downtrend resumption.
Keep in mind we are in the early throws of the June opening-range with U.S. Non-Farm Payrolls on tap Friday. Stay nimble into the release and watch the weekly closes here for guidance. Review my latest US Dollar Short-term Outlook for a closer look at the near-term DXY technical trade levels.
Key US Economic Data Releases
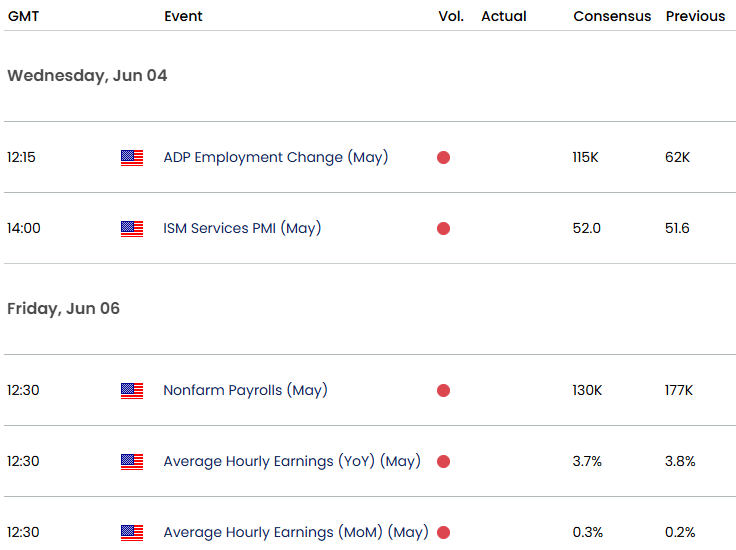
Economic Calendar - latest economic developments and upcoming event risk.
Active Weekly Technical Charts
- British Pound (GBP/USD)
- Swiss Franc (USD/CHF)
- Euro (EUR/USD)
- Canadian Dollar (USD/CAD)
- Australian Dollar (AUD/USD)
- Japanese Yen (USD/JPY)
- Gold (XAU/USD)
- S&P 500, Nasdaq, Dow
--- Written by Michael Boutros, Sr Technical Strategist
Follow Michael on X @MBForex
Latest market news
September 18, 2025 02:48 PM
June 23, 2025 01:22 PM
June 23, 2025 10:39 AM
June 20, 2025 05:23 PM
June 20, 2025 04:46 PM
June 20, 2025 03:35 PM

June 20, 2025 04:46 PM

June 20, 2025 03:35 PM

June 20, 2025 02:18 PM

June 20, 2025 12:21 PM