
US Dollar Index Technical Forecast: USD Weekly Trade Levels (DXY)
- US Dollar rebound off support poised to mark third weekly advance- rallies 3%
- USD stalls at initial resistance ahead of Switzerland tariff negotiations- U.S. CPI on tap
- DXY Resistance 100.81, 102.60/99 (key), ~104.42- Support 99.58/66, 97.69-98.39 (key), 94.65/98
The US Dollar is up just 0.3% this week with the bulls attempting to mark a third consecutive weekly advance on the heels of the FOMC rate decision. The rally exhausted into initial resistance and the focus now shifts to the U.S. / China tariff negotiations in Switzerland this weekend. Battle lines drawn on the DXY weekly technical charts heading.
Review my latest Weekly Strategy Webinar for an in-depth breakdown of this USD setup and more. Join live on Monday’s at 8:30am EST.US Dollar Price Chart – USD Weekly (DXY)
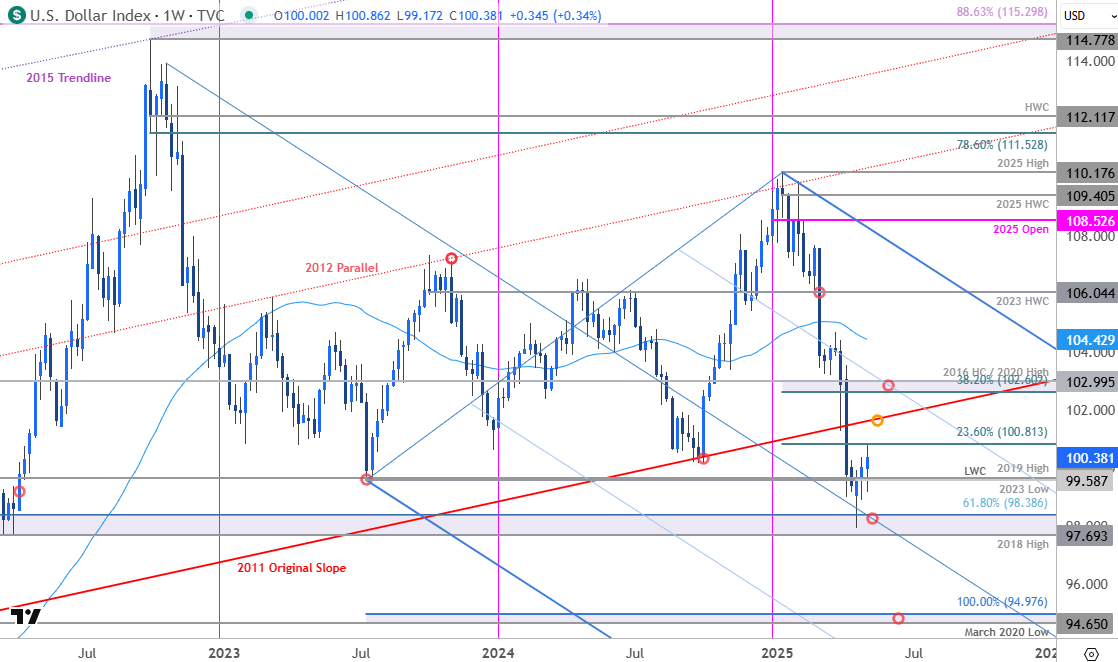
Chart Prepared by Michael Boutros, Sr. Technical Strategist; DXY on TradingView
Technical Outlook: In my last US Dollar Technical Forecast we noted that a five-week decline was testing key support and that, “the immediate decline may be vulnerable while above the median-line. Looking for possible exhaustion / price inflection into this zone in the days ahead. From a trading standpoint, rallies should be limited to the 2011 slope (101.50s) IF price is heading lower on this stretch…” The index has rallied 3% off those lows with the bulls exhausting into initial resistance this week at the 23.6% retracement of the yearly range near 100.81.
Initial weekly support rests with the 2023 low / the 2019 high / 2025 low-week close (LWC) at 99.59/66 with key support unchanged at 97.69-98.39. A break / weekly close below this threshold is needed to mark downtrend resumption towards subsequent objectives at the March 2020 low / 100% extension of the 2022 decline at 94.65/98.
A topside breach here exposes the 2011 trendline (101.50s) with broader bearish invalidation steady at 102.60/99- a region defined by the 38.2% retracement of the yearly range, the 2020 swing high, and the 2016 high-close (HC). A weekly close above this threshold would suggest a more significant low is in place / a larger trend reversal is underway towards the 52-week moving average (currently ~104.42).

Bottom line: The U.S. Dollar recovery has exhausted into initial resistance with major event risk on tap this weekend. From at trading standpoint, losses should be limited to 99.58 IF price is heading higher on this stretch with a close above 100.81 needed to fuel the next leg of the advance.
Keep in mind the Switzerland trade talks have the potential to fuel some major gaps into the Sunday open. A good time to reduce position sizes and reassess protective stops- watch the weekly closes here for guidance. Review my latest US Dollar Short-term Outlook for a closer look at the near-term DXY technical trade levels.
Key US Economic Data Releases
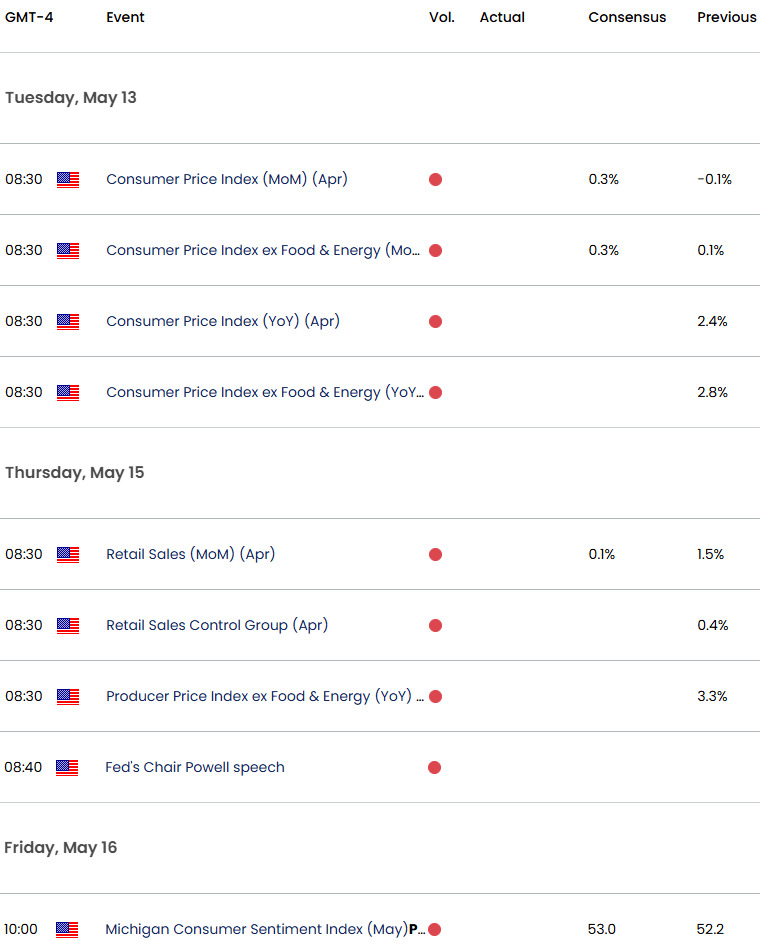
Economic Calendar - latest economic developments and upcoming event risk.
Active Weekly Technical Charts
- Euro (EUR/USD)
- S&P 500, Nasdaq, Dow
- Swiss Franc (USD/CHF)
- Japanese Yen (USD/JPY)
- Crude Oil (WTI)
- Australian Dollar (AUD/USD)
- British Pound (GBP/USD)
- Canadian Dollar (USD/CAD)
--- Written by Michael Boutros, Sr Technical Strategist
Follow Michael on X @MBForex
Latest market news
September 18, 2025 02:48 PM
June 23, 2025 01:22 PM
June 23, 2025 10:39 AM
June 20, 2025 05:23 PM
June 20, 2025 04:46 PM
June 20, 2025 03:35 PM

June 20, 2025 04:46 PM

June 20, 2025 03:35 PM

June 20, 2025 02:18 PM

June 20, 2025 12:21 PM