

Weekly Technical Trade Levels on USD Majors, Commodities & Stocks
- Technical setups we are tracking into the weekly open
- Next Weekly Strategy Webinar: Monday, June 2 at 8:30am EST
- Review the latest Video Updates or Stream Live on my YouTube playlist.
In this webinar we take an in-depth look at the technical trade levels for the US Dollar (DXY), Euro (EUR/USD), British Pound (GBP/USD), Australian Dollar (AUD/USD), Canadian Dollar (USD/CAD), Japanese Yen (USD/JPY), Swiss Franc (USD/CHF), Gold (XAU/USD), Silver (XAG/USD), Crude Oil (WTI), S&P 500 (SPX500), Nasdaq (NDX), Dow Jones (DJI), and Bitcoin (BTC/USD). These are the levels that matter on the technical charts into the weekly open / monthly close.
British Pound Price Chart – GBP/USD Daily
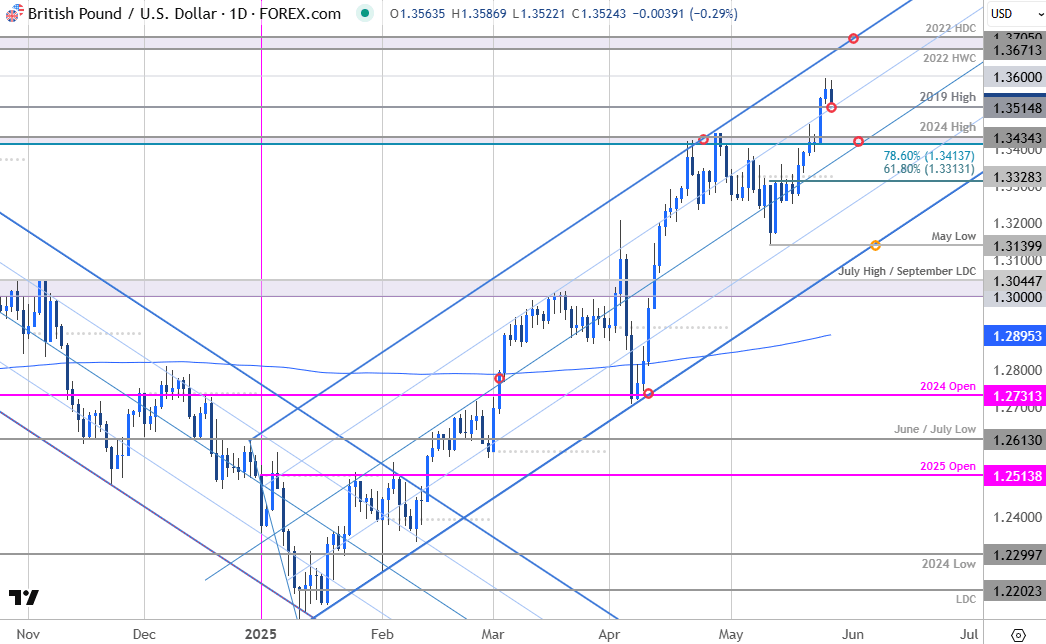
Chart Prepared by Michael Boutros, Sr. Technical Strategist; GBP/USD on TradingView
The British Pound broke to fresh multi-year highs last week with GBP/USD ripping through key technical resistance at 1.3414/34- a region defined by the 78.6% retracement of the 2021 decline and the 2024 swing high. The rally extended more than 3.4% off the monthly lows with price exhausting just ahead of the 1.36-handle. Initial support now back at the 2019 high at 1.3515 and losses should not exceed 1.3414 IF price is heading higher on this stretch. Subsequent resistance is eyed at the 2023 high-week close (HWC) / 2022 high-day close (HDC) at 1.3671-1.3705.
Ultimately a close below the 61.8% retracement / monthly open at 1.3313/28 would be needed to suggest a more significant high is in place / a larger reversal is underway. Review my latest British Pound Technical Forecast for a closer look at the longer-term GBP/USD trade levels.

Canadian Dollar Price Chart – USD/CAD Daily
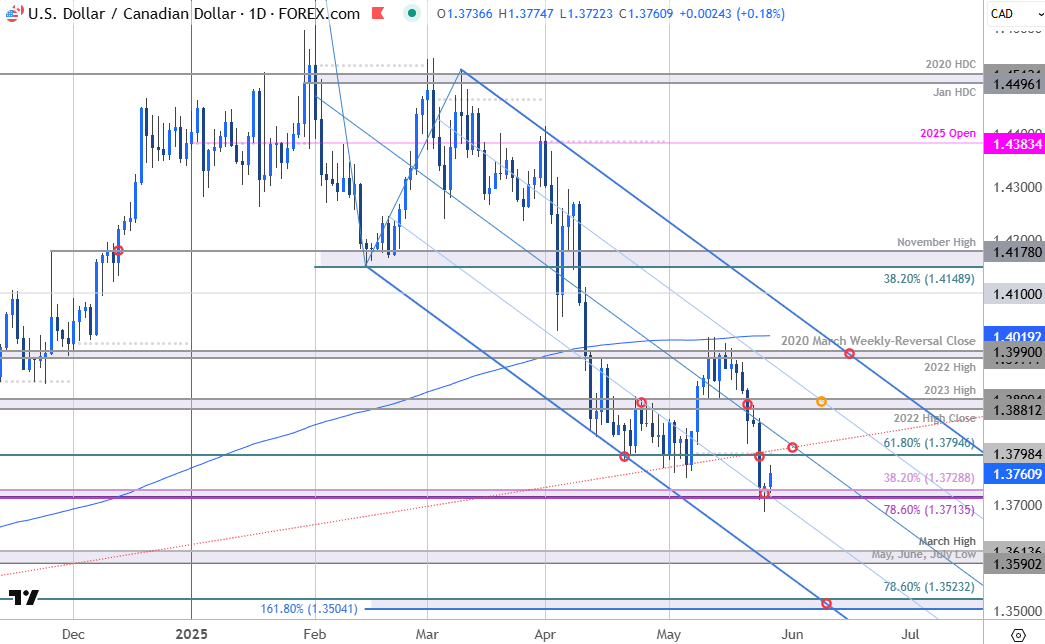
Chart Prepared by Michael Boutros, Sr. Technical Strategist; USD/CAD on TradingView
USD/CAD has responded to confluent support at 1.3714/29- a region defined by the 78.6% retracement of the September rally and the 38.2% retracement of the 2021 advance. Note that the 25% parallel of the descending pitchfork converges on this threshold over the next few days and a break / close below is needed to fuel the next leg of the decline / mark downtrend resumption.
Initial resistance is eyed with the 61.8% retracement of the late 2023 advance / May open at 1.3794/98 and is backed closely by the median-line. Rallies should be limited to this slope IF price is heading lower on this stretch with a break / close below this pivot zone exposing subsequent objectives at 1.3590-1.3614 and 1.3504/23. Broader bearish invalidation extends into the 200-day moving average at 1.3990-1.4019. Review my latest Canadian Dollar Forecast for a closer look at the longer-term technical trade levels.
Economic Calendar – Key USD Data Releases
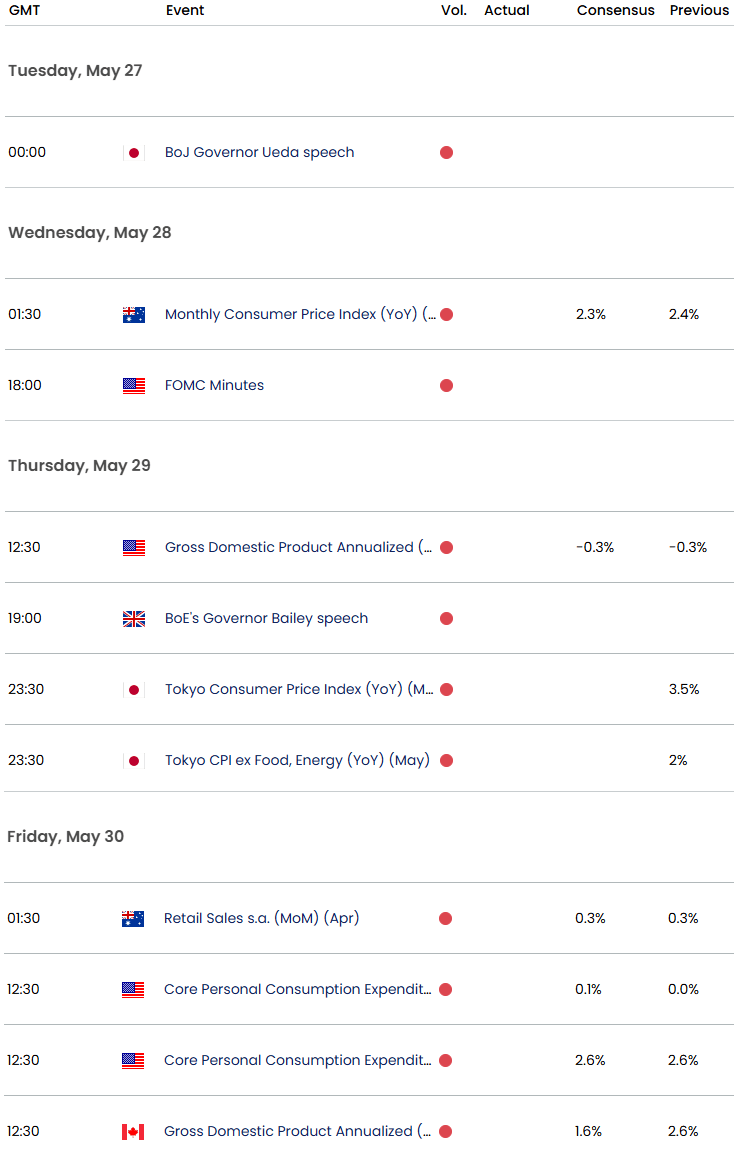
Economic Calendar - latest economic developments and upcoming event risk.
--- Written by Michael Boutros, Sr Technical Strategist
Follow Michael on X @MBForex
Latest market news
September 18, 2025 02:48 PM
June 23, 2025 01:22 PM
June 23, 2025 10:39 AM
June 20, 2025 05:23 PM
June 20, 2025 04:46 PM
June 20, 2025 03:35 PM

June 19, 2025 08:48 AM

June 18, 2025 08:43 AM

June 17, 2025 08:37 AM

June 17, 2025 08:23 AM