

U.S. Dollar Talking Points:
- The weekly chart of DXY went oversold for the first time since last August, and chasing prices lower with that backdrop can fast become complicated such as we saw in Q3 of last year.
- From that prior episode, we can also see where oversold doesn’t automatically mean a strong reversal, as it took more than a month for prices to turn and at this point sellers still have an open door to continue bearish DXY trends.
- Central bank rate decisions out of Canada and Europe could sway the matter this week. I looked into USD/CAD in the weekend article and in this one, I go deeper behind EUR/USD and DXY.
The weekly chart can be a great spot to observe trends as market moods and sentiment can seem very clear. It may not be as actionable as the daily or four-hour given that there’s only one bar per week or 52 bars per year, but in looking at DXY with hindsight those prior trends or even those prolonged range-bound environments become quite clear.
This is like the case in USD/CAD, where, so far, the nine-year-range has prevailed even despite the spike up to fresh 20-plus year highs back in February. If you were tracking that theme from shorter-term charts, it would be difficult to ignore the possibility of a push up to 1.5000, or perhaps even higher, as USD/CAD broke out in a very big way on the back of tariff fears.
But, from the monthly chart that early-February break ended up being the high water mark as the monthly bar closed as indecisive; and then in March, the 1.4500 handle held a lower high and that longer-term range remained of attraction, followed by last week’s break back-below the 1.4000 handle.
In DXY, prices have been in a clear downtrend over the past few months and that’s certainly the case since the March open, which has allowed for DXY to push into oversold territory on the weekly chart for the first time since last August. But – this is a rare occurrence as before last August, that hadn’t happened since 2018.
Last year’s episode was particularly interesting as an aggressive sell-off during the summer, as markets geared up for the Fed to start cutting rates, drove DXY down towards the 100 level. Sellers stopped short of a test at the big figure, but they didn’t quite give up as lower-highs held, a clear sign that bears were fading bounces in the pair. This led to a case of RSI divergence in DXY as a falling wedge formation built, and the currency then broke out in a very big way around the Q4 open.
That’s but one example and this does not mean that a reversal is imminent in the U.S. Dollar. But – for those looking to chase bearish trends lower, it does emphasize the importance of caution as the bearish move in DXY is already extended.
U.S. Dollar Weekly Chart
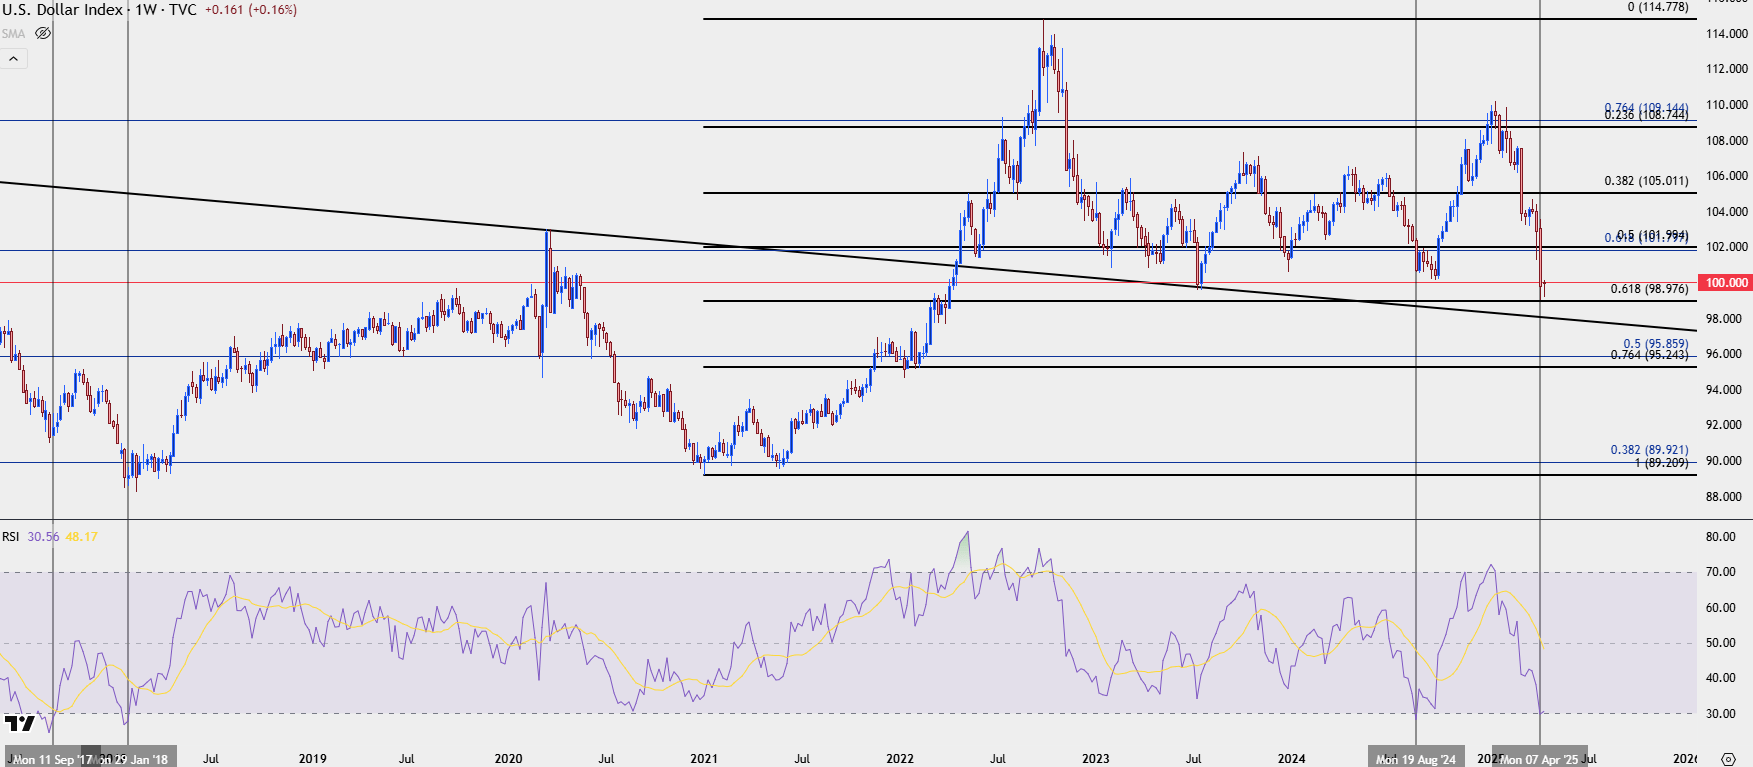 Chart prepared by James Stanley; data derived from Tradingview
USD Daily
From the daily chart we can get a better view of current support, which has shown right around the 61.8% Fibonacci retracement of the 2021-2022 major move, plotted at 98.98. This led to an extended lower wick on Friday and so far this week, bulls defended a higher-low as price has attempted to get back over the 100-handle. Again, this isn’t quite a bullish picture as price has just set a fresh low, but from the daily there is more evidence of bearish pressure slowing.
This then puts the focus on lower-high resistance potential to see if bears do respond, and there’s a few nearby areas of interest for that, such as the gap from last Thursday/Friday that runs up to 100.91, or the swing from the week before at 101.27. With a bit more scope, there’s a zone of interest from 101.80-102 that had led to a bounce before last week’s drubbing, and there’s some additional reference for resistance in that zone from last year’s episode.
That’s the spot that I would like to see bulls take out as indication of larger topside reversal potential.
U.S. Dollar Daily Chart
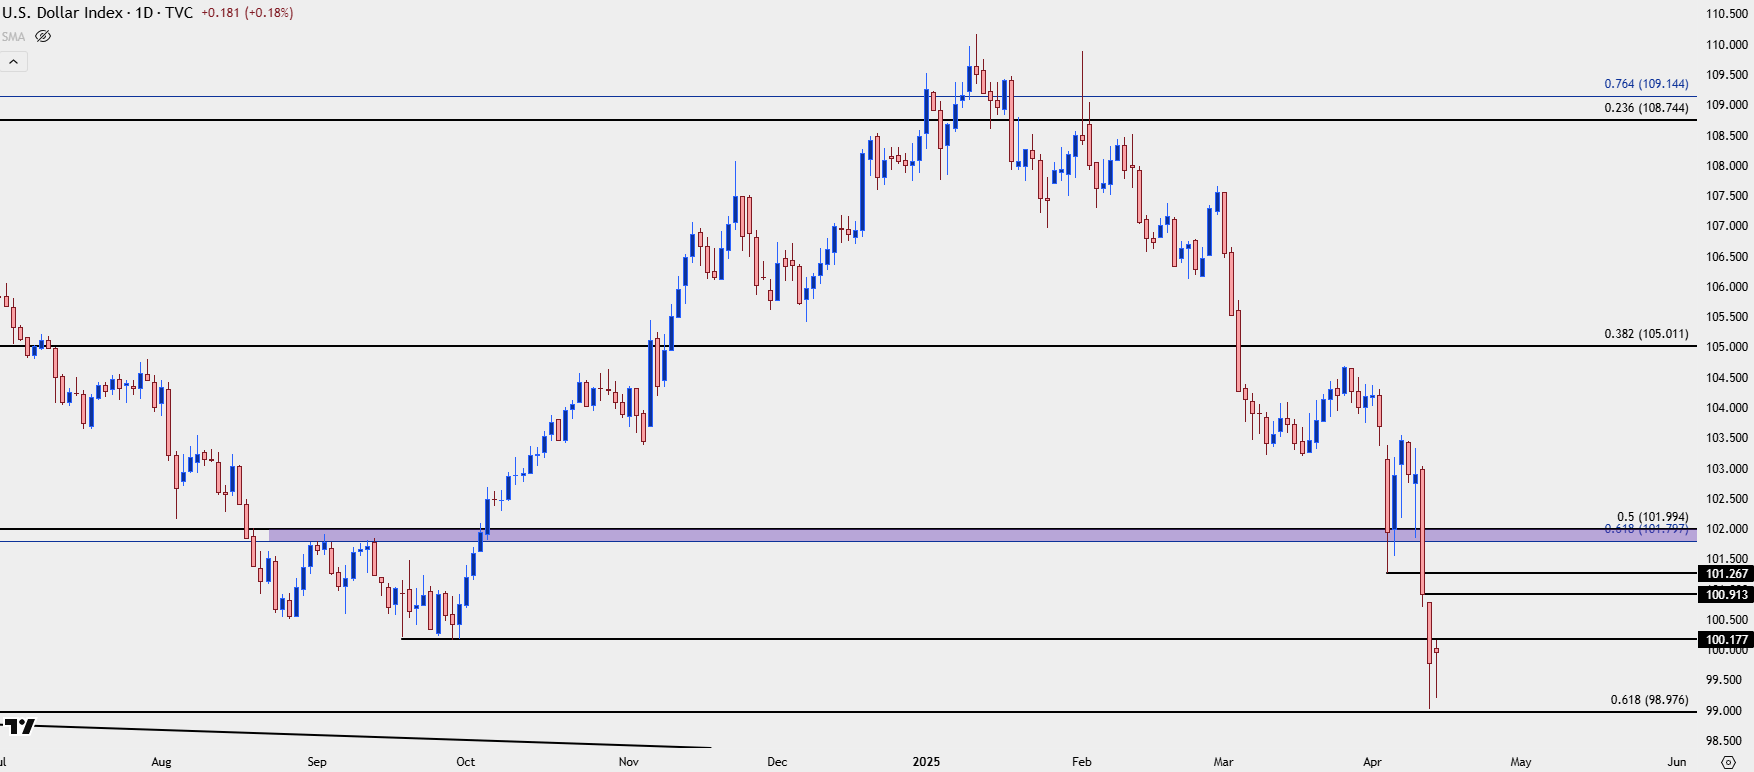 Chart prepared by James Stanley; data derived from Tradingview
EUR/USD
Last week’s breakdown in USD showed a similar breakout in EUR/USD with the pair jumping up to a fresh three-year-high. The pair gained more than 3.6% on the week which rivals the early-March weekly outing of 4.4% gained, and that collectively extends a massive reversal from the sell-off that enveloped the pair in Q4 of last year. This has allowed for the first overbought reading on the weekly EUR/USD chart since August of 2020, although it came very close last August with a weekly close of 69.8.
EUR/USD Weekly Chart
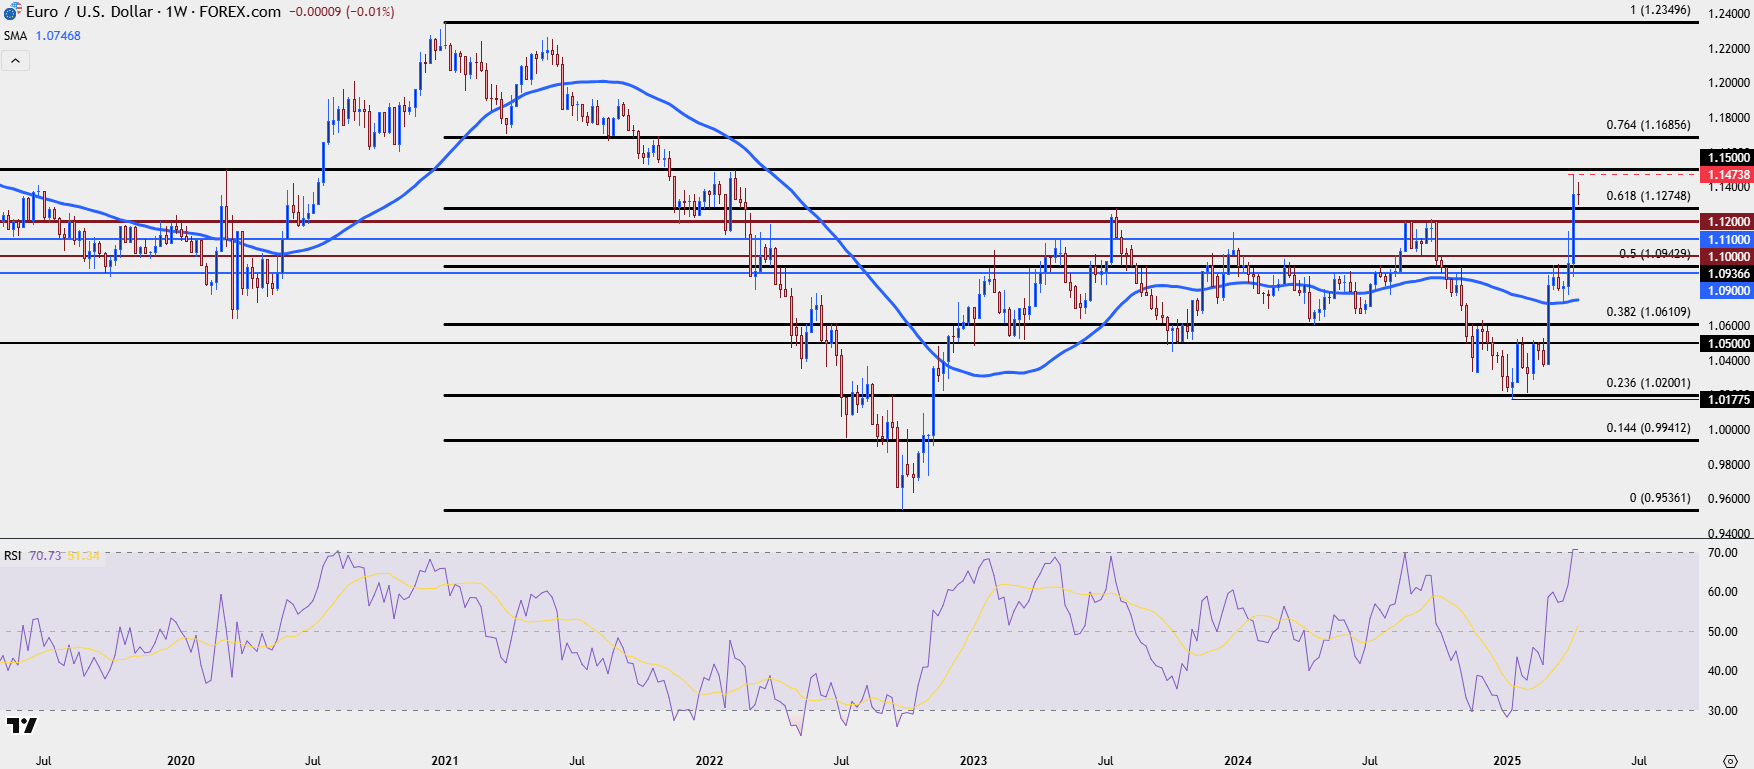 Chart prepared by James Stanley; data derived from Tradingview
Interestingly, EUR/USD was quite calm until the Thursday breakout as the pair had spent the earlier part of the week grasping on to the 1.0900 handle. I had looked at this in last week’s webinar as a USD-weakness setup, highlighting the 1.0943 Fibonacci level of prior resistance as support potential.
That price held the lows on Wednesday which also showed a second consecutive higher-low, and buyers responded in a very big way.
The question now is whether they can continue the move. Like chasing USD-lower in the above scenario is daunting, so too is chasing EUR/USD higher from last week’s breakout. But – given the prior churn in this area of the chart there is considerable reference to track for structure.
The 1.1275 level remains key, as this is the 61.8% retracement of the 2021-2022 major move, and this is the level that held resistance back in 2023. It’s the same retracement from which the 50% mark produces the 1.0943 level, that helped to set the lows last Wednesday after setting the highs on two separate occasions in March.
Below that, it’s the 1.1200 handle and this was a brick wall of resistance back in Q3 of last year, which invariably helped that low to form in the USD ahead of the Q4 reversal.
The 1.1100 level was prior resistance in early-April, and below that it’s the 1.0943 level that was in-play to hold the lows last week. I’m looking at the zone from 1.0900-1.0943 as a form of invalidation for the bullish trend, which also leaves the 1.1000 handle as a possible spot of higher-low support for EUR/USD.

EUR/USD Daily Chart
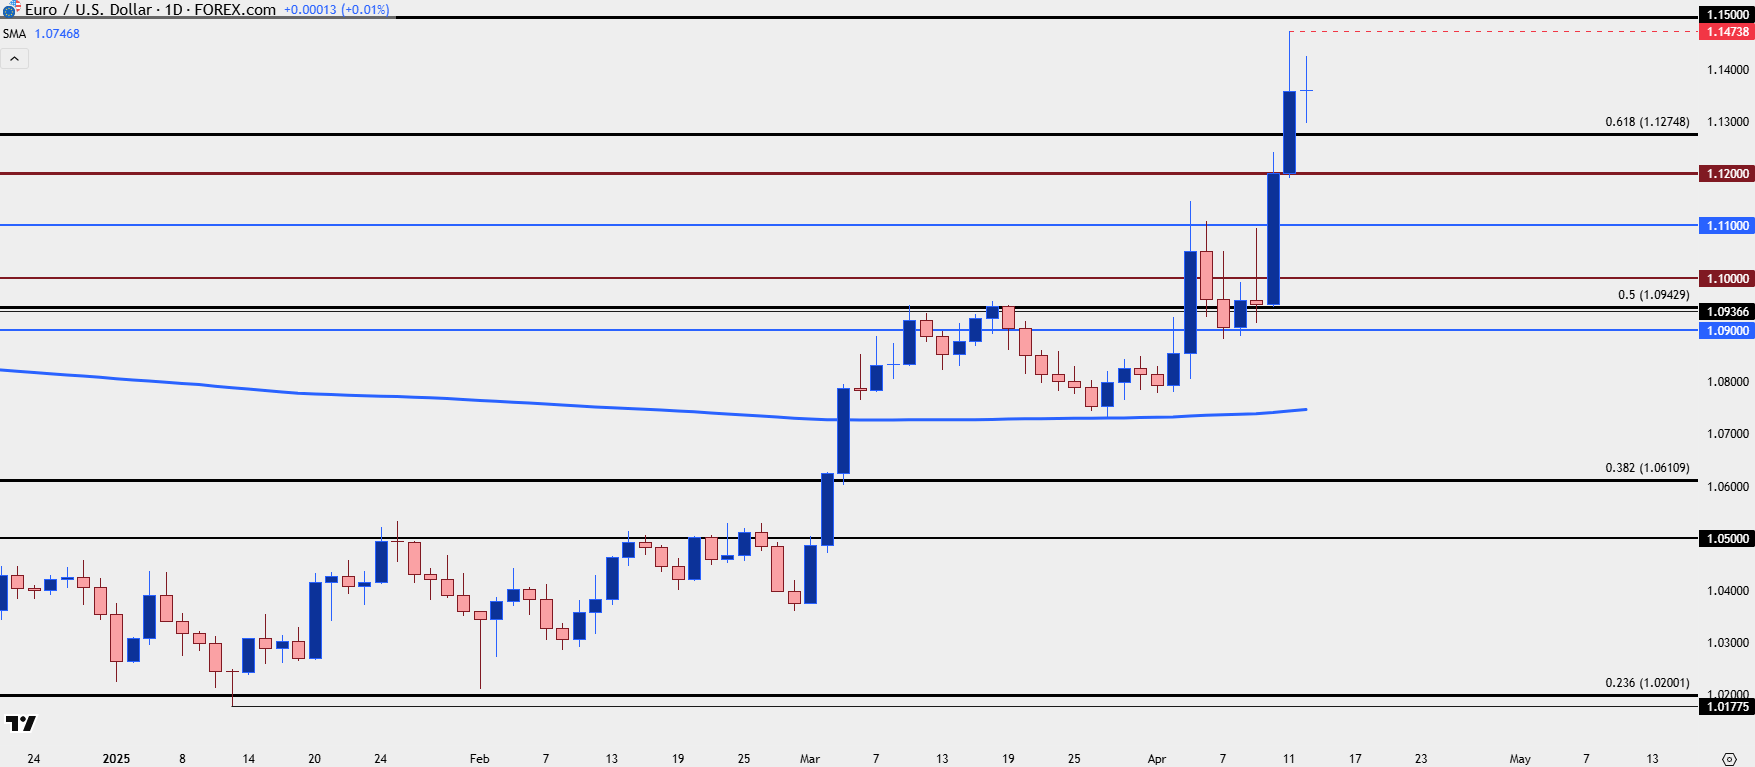 Chart prepared by James Stanley; data derived from Tradingview
--- written by James Stanley, Senior Strategist
Latest market news
September 18, 2025 02:48 PM
June 23, 2025 01:22 PM
June 23, 2025 10:39 AM
June 20, 2025 05:23 PM
June 20, 2025 04:46 PM
June 20, 2025 03:35 PM

February 10, 2025 08:45 PM

February 1, 2025 02:00 AM

January 1, 2025 07:30 AM

December 23, 2024 02:45 PM